
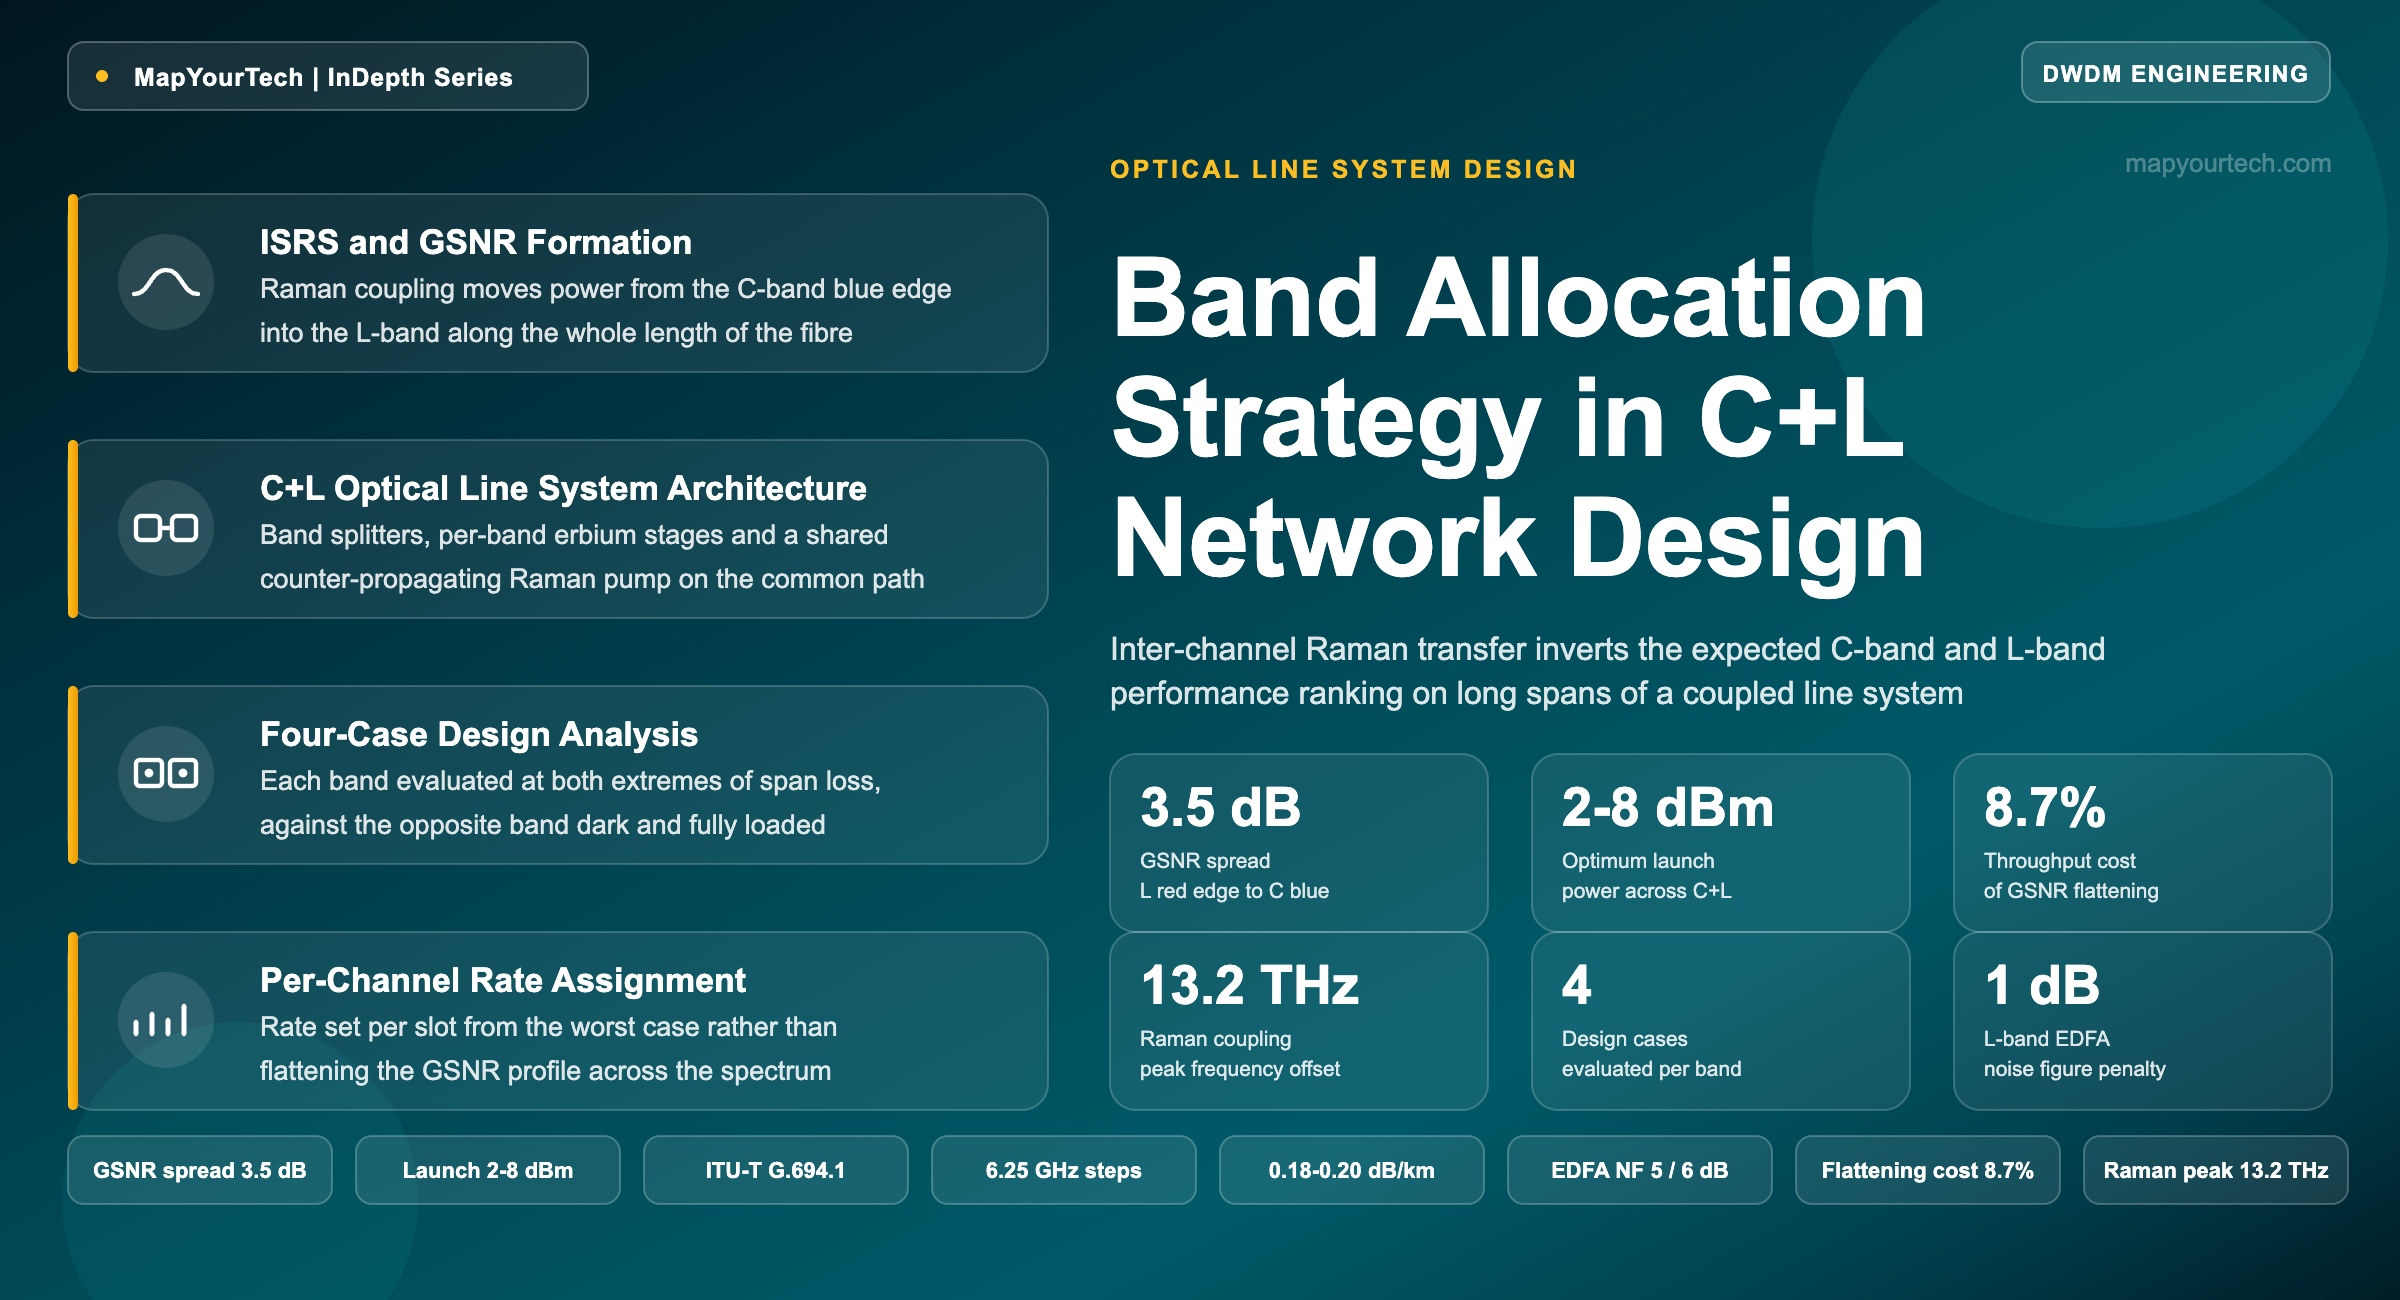
Band Allocation Strategy in C+L Network Design
Inter-channel stimulated Raman scattering inverts the expected performance ranking of a coupled C+L line system: the L-band gains what the C-band blue edge loses, and capacity is maximised by assigning a rate to every channel rather than flattening the spectrum.
1. Introduction
A fully loaded C+L span moves several decibels of optical power from the short-wavelength end of the spectrum to the long-wavelength end before the signal reaches the next amplifier. That transfer is not a second-order correction. Field and laboratory work reports up to about 8 dB of power tilt per span across the two bands at full fill on standard single-mode fiber [measured, industry practice], and the amplifier chain must absorb it span after span. The transfer is a property of the silica itself: photons at higher optical frequency scatter off molecular vibrations and hand energy to photons at lower optical frequency, with the coupling peaking near a 13.2 THz offset in germanosilicate fiber [standard fiber physics]. Every C-band channel is therefore a pump for the L-band, and every L-band channel is a receiver.
The design consequence runs opposite to intuition. Engineers who first meet the L-band meet it as a compromise band: the erbium-doped fiber amplifier (EDFA) noise figure runs roughly 1 dB worse than in the C-band, the component supply chain is thinner, band splitters add insertion loss at every node, and fiber attenuation climbs toward 1625 nm. Design studies routinely assume a 5 dB noise figure in the C-band and 6 dB in the L-band for exactly this reason [modelling convention]. Yet when both bands are lit together and per-channel launch power is optimised for total throughput, the generalized signal-to-noise ratio (GSNR) does not favour the C-band. In a 12 THz super-C+L link of ten 100 km standard single-mode fiber spans with 22.5 dB average span loss, GSNR falls by about 3.5 dB from the lowest-frequency L-band channels to the highest-frequency C-band channels, while the optimum launch power rises from 2 dBm per channel at the bottom of the L-band to 8 dBm per channel at the top of the C-band [modelled, closed-form enhanced Gaussian noise model validated against numerically integrated EGN]. The L-band, on that link, is the better half of the spectrum.
The mechanism is that inter-channel stimulated Raman scattering (ISRS) acts on the L-band as a form of distributed Raman amplification paid for by the C-band. Distributed gain along the transmission fiber holds the L-band signal higher through the span, so the same received power is achieved from a lower launch power, and nonlinear interference (NLI) scales with the cube of launch power. L-band channels consequently propagate close to linearity while C-band channels are pushed into nonlinear propagation to defend their optical signal-to-noise ratio (OSNR) against the same transfer that helps the L-band. Two fiber parameters reinforce the split: chromatic dispersion rises with wavelength, increasing inter-channel walk-off and reducing the efficiency with which NLI accumulates, and effective area also rises with wavelength, lowering the nonlinear coefficient.
The lowest-performing channel in a coupled C+L system is therefore not in the L-band. It sits at the blue edge of the C-band, near 1530 nm and 196.1 THz. That channel undergoes the greatest Raman depletion in the ISRS interaction because every other channel in the system lies below it in frequency. It carries the highest fiber attenuation of any channel in C+L, because Rayleigh scattering falls as the fourth power of wavelength. It has the lowest local dispersion and the smallest effective area in the occupied spectrum, so it generates and absorbs NLI more efficiently than any other channel. It sits on the steepest part of the erbium gain curve, where the gain-flattening filter works hardest and the amplifier noise figure is at its worst inside the band. When the L-band is switched off by a fault or a partial fill, the blue edge sees the largest step in received power and tilt of any channel in the system. Whatever else a C+L design gets right, the blue edge of the C-band sets the worst-case GSNR.
1.1 Scope and Structure
This article treats band allocation as an engineering discipline rather than a capacity headline. Doubling the occupied spectrum from roughly 4.8 THz to roughly 9.6 THz, or from 6 THz to 12 THz in super-C and super-L variants, does not double delivered capacity by itself, because the second band changes the physics that the first band was designed against. What follows works through the coupling physics, the amplifier and node architecture the coupling forces, the closed-form models that make span-by-span optimisation tractable, the four-case design analysis that a planning tool must evaluate, and the allocation policies that convert a non-flat GSNR profile into carried traffic.
The central design claim is that the profile should not be flattened. Flattening GSNR is an operational convenience: it lets a single line rate be provisioned anywhere in the spectrum and simplifies restoration. It also costs capacity, and the cost grows with link length. On a 1000 km C+L+S link with three backward Raman pumps, driving the peak-to-peak GSNR variation down from 6.2 dB to 0.7 dB reduced total throughput from 124.6 Tb/s to 113.7 Tb/s, a loss of about 8.7% [modelled, closed-form EGN with double Rayleigh backscattering]. A partial flattening to 2.7 dB peak-to-peak cost only 2.9%. The capacity that flattening gives away is exactly the capacity that per-channel rate assignment keeps.
Readers new to the two-band problem may want the mechanism background in the MapYourTech treatment of C+L band DWDM system fundamentals before working through the models in Section 5. The amplifier behaviour assumed throughout is set out in the reference material on EDFA gain and noise characteristics.
Takeaway: In a coupled C+L system the spectrum is not two independent bands sharing a fiber. It is one Raman-coupled medium in which the C-band pays for the L-band, the blue edge of the C-band pays the most, and the resulting GSNR gradient of 3.5 dB or more is a permanent design input rather than a defect to be corrected.
2. Development of Band-Division Multiplexing
The C-band became the transmission window because erbium happens to have a useful emission cross-section between 1530 nm and 1565 nm, not because silica is uniquely transparent there. That accident fixed the industry on roughly 4.8 THz of usable spectrum for three decades, and every component class — tunable lasers, wavelength selective switches (WSS), modulators, coherent receivers — was optimised inside that window. The result is a mature, low-cost supply chain over a band that covers less than a tenth of the fiber's low-loss region.
2.1 Capacity Pressure and the Exhaustion of Spectral Efficiency
Through the 2010s, capacity growth came from spectral efficiency rather than spectrum. Coherent detection with digital signal processing moved the industry from 10 Gb/s on-off keying to dual-polarisation quadrature phase-shift keying, then to 16QAM, 64QAM and probabilistic constellation shaping. Each digital signal processor (DSP) generation delivered roughly twice the capacity at a similar power envelope through silicon node advances, better forward error correction and shaping. That route is bounded. The ultimate shaping gain for the additive white Gaussian noise channel is πe/6, about 1.53 dB [theoretical limit], and practical shaping realises 0.8–1.5 dB of it. Once a transponder operates within a decibel or two of the Shannon bound at its operating GSNR, further spectral efficiency has to be bought with reach.
The remaining lever is occupied bandwidth. Adding the L-band, conventionally 1565–1625 nm, roughly doubles the spectrum available on installed fiber without new cable, new ducts or new rights of way. Vendors converged on a symmetric arrangement of about 4.8 THz of C-band and 4.8 THz of L-band for a conventional 9.6 THz system, on the argument that keeping both bands the same width lets the same amplifier and filter designs serve both and keeps component volumes high [vendor position]. Pushing EDFA designs to their edges yields super-C and super-L bands of about 6 THz each, for roughly 12 THz total, an increase of 20–30% over the earlier C+L arrangement [industry practice].
2.2 Band Definitions and Occupied Spectrum
Band edges are conventions, and design documents disagree about them by hundreds of gigahertz. The ITU-T spectral band nomenclature places the C-band at 1530–1565 nm and the L-band at 1565–1625 nm. The 50 GHz dense wavelength division multiplexing grid anchored at 193.1 THz gives 96 channels between 191.275 THz and 196.075 THz in the classic C-band. Published super-band studies use super-L from 184.50 THz to 190.32 THz and super-C from 190.75 THz to 196.57 THz, leaving a guard interval of roughly 400–500 GHz between the bands for the splitter transition [study assumption]. That guard is not spectrum lost to physics; it is spectrum spent on the roll-off of the C/L band splitter and combiner.
Read the Full Analysis with Premium
The remaining 89% of this article — the design numbers, trade-offs and field guidance — is part of MapYourTech Premium, along with the full premium library, courses and professional tools.
You May Also Like

-
Free
-
September 4, 2026

-
Premium
-
September 4, 2026

-
Premium
-
September 4, 2026