Network Latency and Data-Center Site Selection
Fiber propagation is a small, near-fixed share of the end-to-end latency budget. This article quantifies that budget layer by layer and isolates the distance-bound components from the terms proximity cannot reduce.
1. Introduction
Data-center operators in cities and near residential areas almost always give the same reason for being there: latency. The claim is that sitting close to users is what keeps response times low. Optical fiber already carries light at about two-thirds the speed of light in vacuum, so the propagation delay between a user and a metro facility is small — which poses a measurable question: how much of the claim rests on physics, and how much on commercial positioning.
This article quantifies end-to-end latency layer by layer across the communication stack, from the optical fiber up through the transport and application layers and into the data-center fabric, and isolates the distance-bound components that proximity reduces from the terms it cannot. It then compares that physics against 2026 site-selection practice, where power availability, not latency, is the first-order constraint on where facilities are built. Proximity is decisive for a narrow set of workloads and near-irrelevant for most of the rest.
2. Optical Fiber Propagation Delay
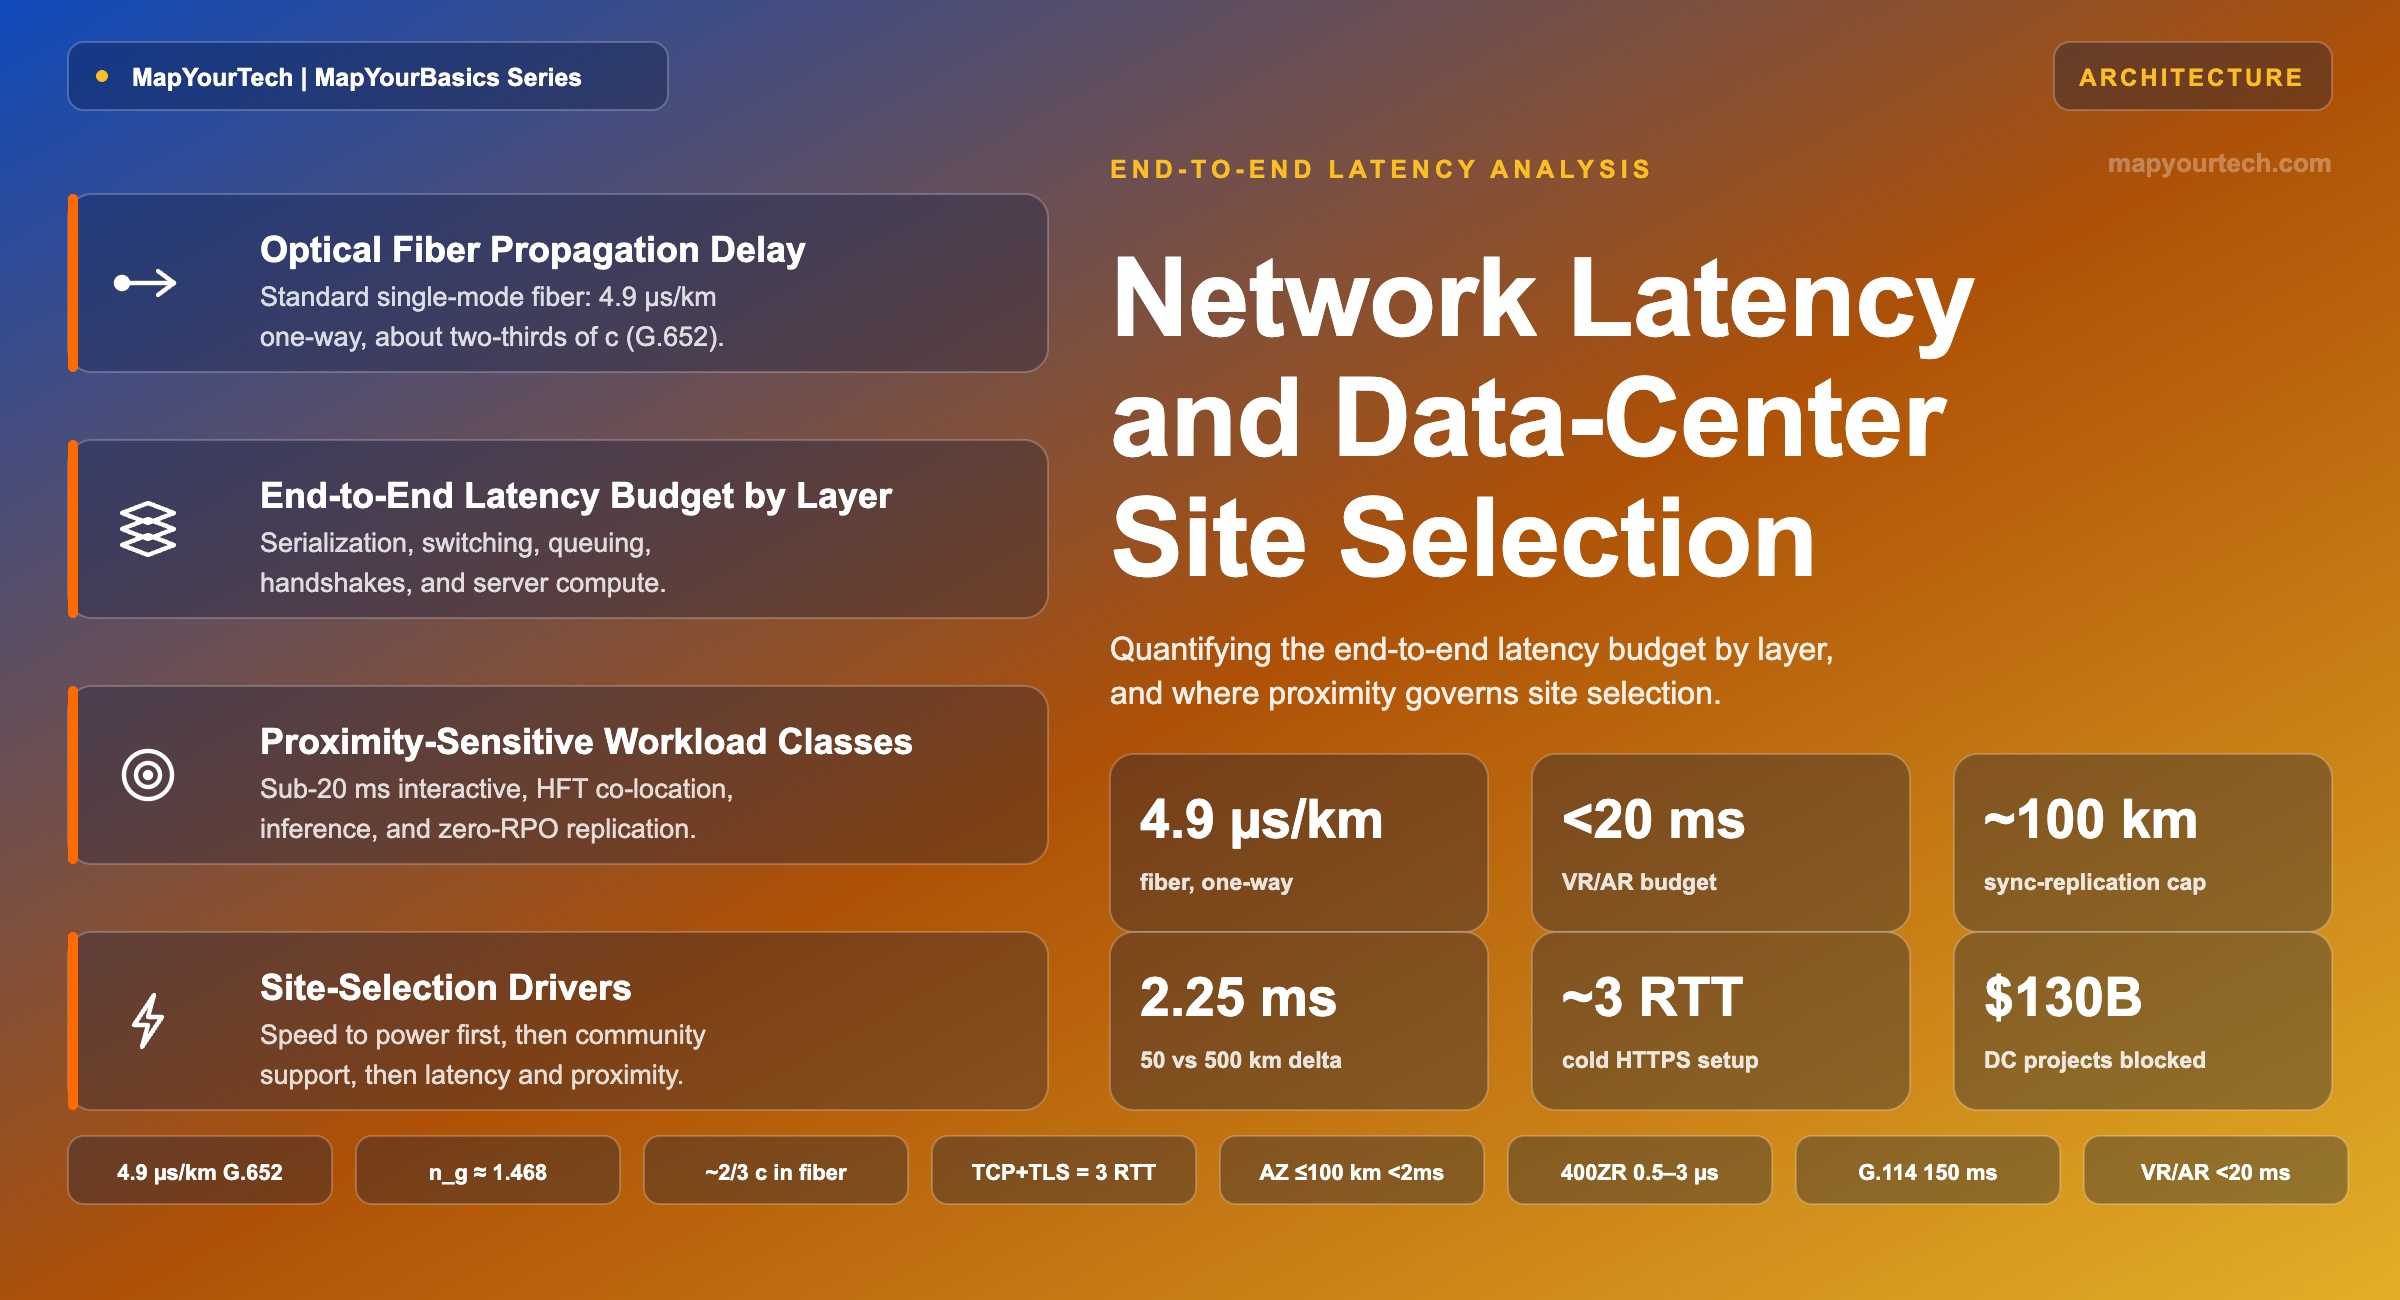
Light in vacuum travels at 299,792.458 km/s, an SI-defined constant. In fiber it slows by the group index ng, the quantity that sets the group velocity of the modulated signal envelope. For ITU-T G.652 standard single-mode fiber, ng is about 1.468 at 1550 nm (standard-specified), giving a propagation speed near 204,000 km/s — roughly two-thirds of c. That yields the industry five-microsecond rule of fiber propagation: about 4.9 µs/km one-way, or roughly 0.49 ms per 100 km one-way and 1 ms round-trip. Over 1,000 km the one-way figure is about 4.9 ms and the round trip about 10 ms — all standard-derived from ng and c.
Fiber type has a minor effect on this figure. G.652 at 1550 nm (ng near 1.4682), G.655 non-zero dispersion-shifted fiber, and ultra-low-latency fiber (ng near 1.462) differ by well under 1%, a few microseconds over 100 km. The refractive index of silica is a material property, so light cannot be made faster in glass; the only way past the two-thirds-c floor is to remove glass from the path, which is the premise of hollow-core fiber. Microsoft states that its Azure hollow-core design delivers about 33% lower latency and up to 47% faster transmission than single-mode fiber (vendor figures), with over 1,280 km deployed and measured loss below 0.1 dB/km as of early 2026; independent analysts place general metro availability in the early 2030s.
Two arithmetic results define the physical-layer limit. A user 50 km away sees about 0.25 ms one-way of propagation; at 500 km it is about 2.5 ms — a ten-fold distance increase adds only about 2.25 ms one-way (standard-derived). And fiber never runs straight: measured route length runs about 1.2 times the straight-line distance in metro and 1.4 to 1.6 times intercontinental, so even the propagation component is larger than a straight-line estimate suggests, though still small in absolute terms across a metro. At the optical layer, the design choices that determine added latency are the dispersion-compensation method and the transceiver type: replacing dispersion-compensating fiber with fiber Bragg gratings removes a 15 to 25% propagation penalty, and coherent DSP adds on the order of 1 µs (measured) — both covered in the treatment of latency optimization at the optical layer.
Takeaway: The propagation floor is a physical lower bound but small in metro terms — about 4.9 µs/km, and about 2.25 ms one-way between a 50 km and a 500 km site. It sets a hard lower bound, not the latency a user perceives.
3. End-to-End Latency Budget by Layer
Propagation is one of roughly seven contributors to end-to-end latency in fiber-optic networks, and most of the others do not scale with distance to the user. Figure 1 shows the path a request takes and marks the one stage that decreases as the site moves closer to the user.
Serialization — clocking a frame onto the medium — is standard-calculable: a 1,500-byte frame takes about 12 µs at 1 Gbps, 1.2 µs at 10 Gbps, and 0.12 µs at 100 Gbps. It is negligible in the core and matters only on constrained access links. Switching and routing add per-hop delay: cut-through Ethernet forwards after reading the destination MAC address at 500 ns to under 20 µs, modern data-center merchant silicon runs 1 to 2 µs per hop, and well-optimized routers add 25 to 50 µs per hop (measured). These are small when unloaded and accumulate with hop count, not with distance.
Queuing is the largest and most variable term. Under the M/M/1 model, mean wait is 1/(μ−λ); as utilization approaches 1, wait grows without bound. Congested buffers hold packets for tens to hundreds of milliseconds (standard model and measured), which exceeds the 4.9 µs/km propagation term by orders of magnitude. Handshakes add fixed round trips: the TCP three-way setup costs one round trip before data (RFC 9293), TLS 1.3 adds one more (RFC 8446), so a cold HTTPS request is about three round trips before the first byte — standard-specified. TLS 1.3 zero-RTT resumption removes one round trip when it applies.
Because these setup costs are counted in round trips, each is multiplied by the path RTT, and back-ends with many sequential round trips accumulate them. Cloudflare documents that a database interaction without connection pooling can incur one TCP, three TLS, and three authentication round trips — seven before the query runs (measured). The illustrative budget below shows the consequence: on a metro path the setup round trips and server compute already dominate, so removing one handshake or one database-authentication cycle reduces total latency more than removing 1 ms of propagation.
| Contributor | Typical value | Evidence class | Distance-bound |
|---|---|---|---|
| Fiber propagation | 4.9 µs/km one-way | Standard-derived | Yes |
| Route stretch | 1.2 to 1.6× straight-line | Modeled / measured | Yes |
| Serialization (1,500 B) | 12 µs at 1 G to 0.12 µs at 100 G | Standard-calculable | No |
| Switch hop (cut-through) | 0.5 to 20 µs | Measured | Hop count only |
| Router hop | 25 to 50 µs | Measured | Hop count only |
| Queuing / buffering | 0 to hundreds of ms | Measured / variable | No |
| TCP setup | 1 round trip | Standard (RFC 9293) | Via RTT |
| TLS 1.3 setup | 1 round trip | Standard (RFC 8446) | Via RTT |
| Coherent DSP (400ZR) | 0.5 to 3 µs | Measured | No |
| Server compute + fan-out | 8 to 100 ms | Measured | No |
Takeaway: Serialization and switching are microseconds; queuing and server compute are milliseconds to hundreds of milliseconds and do not shrink with proximity. Distance changes propagation and hop count only, leaving the two largest variable terms untouched.
4. Proximity-Sensitive Workload Classes
Distance still governs placement for four workload classes, for reasons other than raw propagation speed.
Human-perception thresholds. Virtual and augmented reality need motion-to-photon delay below 20 ms, with trained observers detecting as little as 3.2 to 3.4 ms; competitive gaming targets under 50 ms; interactive video degrades above about 300 ms round-trip, and ITU-T G.114 names 150 ms one-way as the preferred maximum for conversational quality (standard). Rendering alone can consume most of a 20 ms budget, so propagation and last-mile leave no timing margin, and edge placement becomes mandatory.
Financial co-location. Trading firms place servers within the exchange building, meters from the matching engine, for a round trip under 100 µs versus 50 to 100 ms for a retail order — about a thousand-fold difference (measured). On the Chicago to New York corridor, microwave links run at about 99.7% of c in air versus about 67% in fiber, cutting one-way latency from roughly 13 ms to 8 ms (measured). This is a genuine proximity requirement, set by physical distance to the matching engine and by the propagation medium.
Synchronous replication. This is the one unavoidable speed-of-light constraint. Every write must be acknowledged by the remote copy before commit, placing one full round trip on the critical path of each write. Storage and database guidance converges on under 5 ms round-trip and about 100 km as the practical zero-RPO limit; Oracle Data Guard reports better results below 5 ms round-trip. This is why cloud Availability Zones sit up to about 100 km (60 miles) apart with inter-zone latency below 2 ms (vendor and standard). Asynchronous replication removes the distance limit but accepts a non-zero data-loss window.
Edge and inference. The 5G radio access network adds several milliseconds one-way, and TDD scheduling contributes about 1.5 ms of variable delay (measured); multi-access edge computing places compute at the radio edge to meet real-time budgets for augmented reality, cloud gaming, and connected vehicles. Inference is the 2026 shift: as inference workloads overtake training — projected in 2027 — demand is moving toward distributed, latency-aware placement near users, so the edge case for proximity is expanding while the hyperscale training case is not.
| Workload | Latency budget | Role of proximity |
|---|---|---|
| Web / SaaS / streaming | Hundreds of ms tolerated | Insensitive; CDN caching, not origin proximity |
| AI training | Throughput-bound, seconds+ | Insensitive; site for power |
| AI inference | Tens of ms | Increasingly sensitive; distributed placement |
| Cloud gaming | Under 50 ms | Sensitive; metro or telco edge |
| VR / AR | Under 20 ms motion-to-photon | Sensitive; edge mandatory |
| Interactive voice / video | 150 ms one-way (G.114) | Path-sensitive; handshakes and hops matter |
| High-frequency trading | Under 100 µs | Sensitive; exchange co-location |
| Zero-RPO replication | Under 5 ms RTT, ~100 km | Hard physics limit |
Takeaway: Proximity is decisive for four classes — sub-20 ms interactive, financial co-location, real-time inference, and zero-RPO synchronous replication. For general cloud, streaming, SaaS, and AI training, the propagation saving from moving closer is negligible against the total budget.
5. Data-Center Siting Drivers in 2026
For everything outside those four classes, the reason a facility sits where it does in 2026 is usually not latency. JLL's 2026 outlook ranks speed to power as the primary site-selection criterion, followed by community support, then latency and proximity to customers (industry source). Grid-connection waits in primary markets now exceed four years, pushing operators toward behind-the-meter generation and toward secondary or rural sites with deliverable power and cheap land — the opposite of siting for user proximity. AI training, which carries no meaningful latency budget, reinforces that shift toward power-rich remote sites.
Community acceptance has become a first-order constraint on urban and near-residential siting. Data Center Watch recorded at least 75 projects worth about $130 billion blocked or delayed in the first quarter of 2026 — equal to the full-year 2025 total in one quarter — with active opposition groups more than doubling to 833 across 49 states and over 300 state bills filed in the first six weeks (reported figures). This pressure works against residential proximity, not toward it.
So when a facility near a neighborhood is described as being there for latency, whether the claim holds depends on the workload it serves. For an edge inference node, a gaming region, a financial venue, or one leg of a synchronous replication pair, the latency case holds. For general cloud origin, streaming, SaaS, or training capacity, "low-latency connectivity" usually means rich peering and low egress cost, not user-proximity propagation — and the binding site drivers are power, land, and permitting.
Takeaway: In 2026 the first-order siting constraint is deliverable power, and community opposition is a hard limit on near-residential builds. Latency is a genuine primary driver only for edge, colocation, real-time interactive, and financial workloads.
6. Latency Budget Analysis for Site Selection
Before paying a proximity premium, partition the target end-to-end budget into propagation, last-mile access, protocol round trips, and compute. If propagation is under 10 to 20% of the budget — true for nearly all web, SaaS, streaming, and training workloads — optimize round trips and compute instead of distance: TLS 1.3 with zero-RTT resumption, QUIC and HTTP/3, connection reuse and pooling, a larger initial congestion window, and CDN edge caching with TLS terminated close to the user. The optical fiber latency calculator returns the propagation term for a candidate route so the budget analysis starts from a measured value.
Match the architecture to the workload class. Interactive workloads under 20 ms need edge or radio-edge nodes within metro range and minimized hop count. Financial workloads co-locate in the exchange and evaluate microwave for inter-venue corridors. General cloud sites its origin for power, cost, and peering and pushes static content to the CDN edge. Training sites for power, cooling, and cheap land in secondary markets. Respect the two hard limits: keep zero-RPO synchronous pairs within about 100 km and under 5 ms round-trip, and treat sub-20 ms interactive budgets as allowing no added distance.
At the optical layer, metro data-center interconnect up to about 120 km runs on 400ZR and OpenZR+ coherent pluggables, whose 0.5 to 3 µs DSP and FEC latency is negligible against the budget; ultra-low-latency short reach such as trading fabrics and storage prefers direct-detect or grey pluggable optics at 100 to 200 ns and avoids unnecessary coherent DSP. Hollow-core fiber is worth evaluating only for genuinely latency-bound metro routes today.
Takeaway: Site for latency only after the budget analysis shows propagation above about 15% of total round-trip time, or a workload below the 20 ms interactive threshold. Otherwise the milliseconds are recovered in the protocol stack and the CDN, and the site should be chosen for power, cost, and peering.
References
- ITU-T G.652 — Characteristics of a Single-Mode Optical Fibre and Cable, ITU-T Study Group 15.
- ITU-T G.114 — One-Way Transmission Time, ITU-T Study Group 12.
- IETF RFC 9293 — Transmission Control Protocol (TCP), Internet Engineering Task Force.
- IETF RFC 8446 — The Transport Layer Security (TLS) Protocol Version 1.3, Internet Engineering Task Force.
- JLL, 2026 Global Data Center Outlook, Jones Lang LaSalle Research.
- Data Center Watch, Q1 2026 Data Center Opposition Report, 10a Labs.
- Sanjay Yadav, "Optical Network Communications: An Engineer's Perspective" — Bridge the Gap Between Theory and Practice in Optical Networking.
Related Articles on MapYourTech