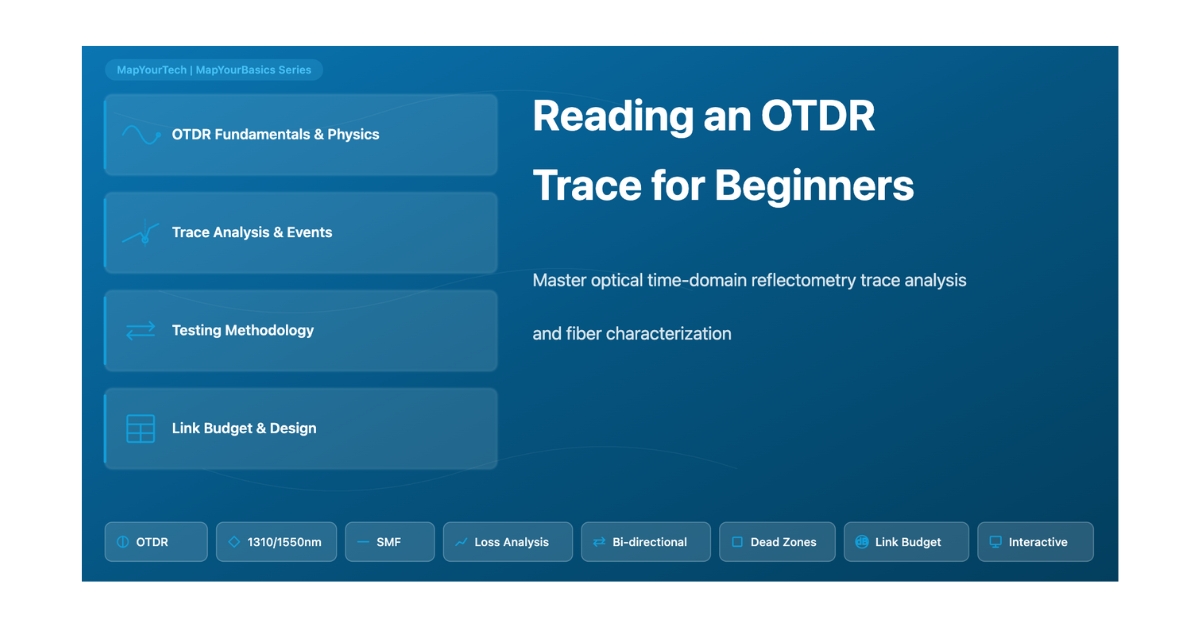
Reading an OTDR Trace
An optical time-domain reflectometer turns a single light pulse into a map of an entire fiber link. This guide explains what the trace is actually showing, the physics behind every feature on it, and how to set the instrument so the numbers you read are the numbers that matter.
Introduction
An OTDR fires a short pulse of light into one end of a fiber and listens to what comes back. Two kinds of light return: a faint, continuous wash of Rayleigh backscatter from the glass itself, and sharp Fresnel spikes wherever the refractive index changes abruptly — a connector, a mechanical splice, or the far end. By timing each return and converting time to distance, the instrument builds a single-ended picture of the whole link: every splice, every connector, the loss of each, and the exact distance to a fault, all from one fiber end.
The trace plots accumulated loss in decibels against distance. Because loss grows with distance, the line slopes downward as power drops, and the slope between events is the fiber's attenuation coefficient in dB/km. Splices and connectors appear as steps down; reflective events add a spike on top of the step. Read correctly, that shape tells you whether a link will carry traffic and, if it will not, where the problem sits. A fuller treatment of the display conventions and automated event tables lives in the companion complete guide to optical time-domain reflectometry.
This article works from the physics up. It covers what produces each feature, the four formulas you actually use, the instrument settings that decide what you can and cannot see, and the field technique that keeps a measurement honest. Four calculators let you change a parameter and watch the trace and the budget respond.
What the trace is made of
Every point on an OTDR trace comes from one of two physical mechanisms, and telling them apart is the first skill to build.
Rayleigh backscatter — the sloping baseline
Silica glass freezes in microscopic density fluctuations during manufacture, smaller than the wavelength of light. Light scatters off these fluctuations in all directions; the small fraction recaptured into the guided mode and travelling back toward the source is Rayleigh backscatter. It is continuous along the whole fiber and sets the sloping baseline the trace rides on. The recaptured level is tiny: for standard G.652 single-mode fiber at 1550 nm the backscatter capture coefficient is approximately -80 dB for a 1 ns pulse, and it scales with pulse width as roughly -80 + 10·log10(pulse width in ns). Because Rayleigh scattering rises as 1/λ4, the backscatter level is higher at 1310 nm than at 1550 nm. This same distributed backscatter is what sets the lower bound on a link's optical return loss.
Fresnel reflection — the spikes
Where the refractive index changes abruptly, a fraction of the light reflects straight back. A flat glass-to-air interface (an open PC connector) reflects about 3.6% of the incident power, which is roughly -14.5 dB — thousands of times stronger than the backscatter baseline. These spikes mark connectors, mechanical splices, and the fiber end. They are useful as landmarks, but a strong reflection saturates the receiver and blinds the instrument for a short distance afterward, which is the origin of the dead zone discussed later. The same -14.5 dB glass-air figure governs the strong end reflections seen in OTDR work on hollow-core fiber.
In one sentenceBackscatter is continuous and tells you about the fiber between events; Fresnel reflections are discrete and tell you where the events are.
When an OTDR earns its place
An OTDR is the right tool when you need a distance-resolved view: acceptance testing a new build, locating a fault to within metres on a buried route, certifying a link for a warranty or contract, and establishing a baseline so later traces reveal what changed. For a single end-to-end loss number it is overkill — a light source and power meter measure total insertion loss more directly. The OTDR's value is the map, not the single number.
Takeaway: The slope is the fiber, the steps are the joints, and the spikes are the reflective interfaces. Once you can name which mechanism produced a feature, the rest of trace reading is bookkeeping.
The math behind the trace
Four relationships cover almost everything you do with an OTDR. None of them is heavy, but the conventions matter — particularly the sign convention for reflectance, which trips up newcomers.
Distance to an event
- d — one-way distance to the event (m)
- c — speed of light in vacuum, 3 × 10⁸ m/s
- t — round-trip time of the pulse (s)
- n — group index of refraction (IOR), about 1.468 for standard SMF at 1550 nm
- 2 — the pulse travels out and back, so the path is twice the distance
A reflection returns 1.0 µs after the pulse left. With c = 3 × 10⁸ m/s the light covered 300 m round trip; dividing by 2n = 2.936 gives 102 m to the event. Scale that up: a reflection at 980 µs sits near 100 km, which is why round-trip times on real spans run into hundreds of microseconds.
Fiber attenuation between two points
- α — attenuation coefficient (dB/km)
- P1, P2 — backscatter levels at two clean points on the slope (dB)
- L — distance between those points (km)
Loss of a single event
Return loss and reflectance — mind the sign
This is where conventions collide. Return loss (and link-level ORL) is reported as a positive magnitude — bigger is better, and a healthy link runs well above 30 dB. Reflectance of one event is negative — more negative is better. An angled (APC) connector reflects around -60 dB or lower; an ultra-polished (UPC) connector around -50 dB; a flat glass-air interface only about -14.5 dB. The same number described two ways causes most of the confusion: a "-60 dB reflectance" connector has a "60 dB return loss". The distinction is worked through in detail in this primer on optical return loss, and the system-level budgeting in optical return loss explained.
Takeaway: If a reflection figure is positive, it is return loss and you want it large; if it is negative, it is reflectance and you want it deeply negative. Coherent systems typically need link ORL of 45 dB or better, which is why APC connectors are standard there.
Reading events on the trace
The display has two axes and one slope to interpret. The vertical axis is signal level in decibels relative to the launch; it falls with distance as power drops. The horizontal axis is distance, derived from time through the distance formula. The slope of the baseline between events is the fiber's attenuation; a steeper section means higher loss per kilometre, which is the signature of a macrobend or a degraded length of fiber.
| Event | Appearance | Typical loss | What it is |
|---|---|---|---|
| Fusion splice | Small step down, no spike | 0.01–0.1 dB | Two fibers fused together; the lowest-loss permanent joint |
| Mechanical splice | Step down, sometimes a small spike | 0.1–0.5 dB | Fibers aligned in a fixture with index-matching gel |
| Connector pair | Spike then step down | 0.3–0.5 dB | Mated connectors; the spike is the Fresnel reflection |
| Macrobend | Steeper slope over a length | Variable, wavelength-dependent | Fiber bent past its minimum radius, leaking light |
| Fiber break | Reflective spike then noise floor | Effectively total | Severed fiber; trace ends at the break |
| Dirty connector | Large spike and large step | Over 1 dB | Contaminated end-face; high loss and high reflection |
| Fiber end | Spike then drop to noise | End of measurement | Normal termination; Fresnel reflection from glass-air |
The "gainer" that is not gain
Sometimes an event shows as a step up — an apparent gain. Fiber does not amplify, so this is an artifact: when the fiber after a splice has a higher backscatter coefficient or a different mode-field diameter than the fiber before it, more light scatters back from the second section and the splice looks like it added power. The real loss is hidden inside that artifact. The fix is to test from both ends and average, which is exactly why bidirectional measurement is mandatory for splice certification.
Watch forA single-direction reading at a splice can show positive or negative loss depending on which fiber you launch from. Neither one-way value is the true splice loss; only the bidirectional average is.
Instrument settings that shape the result
The same fiber produces different traces depending on how the OTDR is set. Four settings decide what you can see.
Dynamic range
Dynamic range is the gap in decibels between the backscatter level at the near end and the instrument's noise floor. It caps how far down the fiber the OTDR can still see backscatter, so it sets the maximum testable length. Short-range units offer roughly 20–25 dB; standard telecom units 30–35 dB; long-haul units 40 dB and beyond. Too little dynamic range and the far end of a long span disappears into noise before you reach the fiber end. The relationship between fiber loss, span length, and the dynamic range you need is the same arithmetic that drives link-level loss and OSNR budgeting.
Dead zones
A strong reflection saturates the receiver, and it needs distance to recover. The event dead zone is the minimum spacing after a reflective event before a second event can be detected at all — typically 1–5 m. The attenuation dead zone is longer, typically 5–20 m, and is the distance before the loss of the next event can be measured accurately. Two connectors closer than the event dead zone merge into one feature; an event inside the attenuation dead zone is visible but its loss reading cannot be trusted. The standard mitigation is a launch fiber ahead of the link and a receive fiber after it, which push the instrument's own end reflections outside the section you care about.
Pulse width — the central trade-off
A short pulse resolves closely spaced events but carries little energy, so it reaches a short distance. A long pulse carries more energy and sees further but smears nearby events together. Resolution follows the distance formula directly: a 100 ns pulse occupies about 10 m of fiber, so it cannot separate events closer than that.
| Pulse width | Resolution | Reach | Where it fits |
|---|---|---|---|
| 3 ns | about 0.3 m | Short | Patch panels, closely spaced events |
| 10 ns | about 1 m | Short | Campus and in-building cabling |
| 30 ns | about 3 m | Medium | Metro spans |
| 100 ns | about 10 m | Long | Regional routes |
| 1000 ns | about 100 m | Longest | Long-haul and submarine |
Wavelength
Single-mode fiber is normally tested at both 1310 nm and 1550 nm, because some defects show up at one wavelength and not the other. Macrobend loss is the clearest example: it is much worse at 1550 nm than at 1310 nm, because the longer wavelength is guided less tightly and leaks more easily at a bend. Multimode fiber is tested at 850 nm and 1300 nm.
| Wavelength | Nominal attenuation | Primary use |
|---|---|---|
| 850 nm | about 3 dB/km (multimode) | Multimode fiber testing |
| 1310 nm | about 0.32–0.35 dB/km | SMF, near the zero-dispersion window |
| 1550 nm | about 0.19–0.22 dB/km | SMF long-haul and DWDM |
| 1625 nm | about 0.23 dB/km | In-service out-of-band monitoring |
AveragingThe OTDR sends many pulses and averages them to lift the trace out of noise. More averaging gives a cleaner trace and longer effective range at the cost of test time — tens of seconds for a quick look, several minutes for a certification-grade trace.
What "pass" looks like
| Parameter | Excellent | Good | Marginal | Re-work |
|---|---|---|---|---|
| Fusion splice loss | below 0.05 dB | 0.05–0.1 dB | 0.1–0.2 dB | above 0.2 dB |
| Connector loss | below 0.3 dB | 0.3–0.5 dB | 0.5–0.75 dB | above 0.75 dB |
| Fiber attenuation @1550 nm | below 0.20 dB/km | 0.20–0.25 dB/km | 0.25–0.30 dB/km | above 0.30 dB/km |
| Link ORL | above 40 dB | 32–40 dB | 28–32 dB | below 28 dB |
| Single-event reflectance | below -50 dB | -50 to -45 dB | -45 to -40 dB | above -40 dB |
Testing technique that holds up
Test from both ends
Bidirectional testing — measuring A→B and B→A and averaging — removes the backscatter-coefficient and mode-field-diameter artifacts that produce false gainers, and it is the method DWDM commissioning procedures require for splice certification, in line with ITU-T G.650.3. For acceptance work and any case where an exact splice loss matters, it is not optional.
Use launch and receive fibers
A launch fiber (50 m to 1 km) placed between the OTDR and the link moves the instrument's front-end dead zone off the first real connector, so that connector's loss becomes measurable. A receive fiber does the same for the far-end connector. Match the launch and receive fiber type to the link, or the backscatter-coefficient difference creates a measurement error at the junction.
Clean before you connect
Contamination is the most common cause of high loss and high reflection on an otherwise good link. Inspect every end-face with a fiber microscope, clean with a proper one-click cleaner or lint-free wipe and fiber-grade solvent, and never mate a connector you have not inspected. The standard is steep where it matters: in the clean-fiber zone of a Raman-pumped span, even a UPC connector at -55 dB reflectance can be inadequate at pump power, and the reflectance budget for high-power links drives toward fusion splices and APC connectors only.
| Symptom | Likely cause | Fix |
|---|---|---|
| Cannot see the fiber end | Too little dynamic range or averaging | Widen pulse, increase averaging, or use a higher-range unit |
| High connector loss | Contamination, damage, misalignment | Inspect, clean, re-terminate if damaged |
| Distances are wrong | IOR set incorrectly | Set IOR to the fiber's group index |
| Adjacent events merge | Pulse too wide for the spacing | Use a shorter pulse |
| Noisy trace | Too little averaging or low signal | Increase averaging, check connections |
| Apparent gain at a splice | Backscatter or MFD mismatch | Test both directions and average |
A repeatable test procedure
A certification-grade measurement follows the same sequence every time, so results are comparable across crews and across years.
- Prepare. Clean and inspect every connector, gather the fiber specifications and expected length, and set wavelength, IOR, and pulse width for the route.
- Connect. Attach the launch fiber to the OTDR, the launch fiber to the link, and a receive fiber at the far end; secure everything against movement.
- Configure. Select 1310 nm and 1550 nm for SMF, set pulse width to the span length, choose an averaging time for the accuracy you need, and set the range slightly beyond the expected length.
- Acquire A→B. Run to completion without interrupting, confirm the fiber end is visible, and save with a descriptive name (location, direction, wavelength).
- Acquire B→A. Repeat from the far end with the same settings.
- Analyze. Average the two directions, mark every event, compare each loss against specification, and record the result with both traces.
A system has 0 dBm launch and -28 dBm receiver sensitivity, so the power budget is 28 dB; the design holds back 3 dB of margin. The OTDR results on a 100 km route: fiber 0.22 dB/km × 100 km = 22.0 dB; four connectors at 0.4 dB = 1.6 dB; eight fusion splices at 0.05 dB = 0.4 dB — a total of 24.0 dB. Against a 28 dB budget that leaves 4 dB, comfortably clearing the 3 dB margin. The same receiver-sensitivity-versus-loss reasoning underpins any optical system power-budget design.
Trace analysis checklist
Before signing off, confirm the following:
- Fiber end is clearly visible.
- Every expected connector and splice is identified, with no surprises.
- Measured length matches the records within about 1%.
- Attenuation slope and every event loss meet specification.
- No reflective event sits above the reflectance limit for the system.
- The two directions agree, and the total is checked against the link budget.
Interactive OTDR toolkit
Four calculators, each on its own tab: a distance-and-loss tool that draws a simulated trace, a dead-zone analyzer, a pulse-width trade-off explorer, and a link-budget analyzer. Change any input with the slider or the number box and the results, badges, and chart update together. Use the presets to jump to a metro, regional, or long-haul starting point, and copy or download any result set.
Below the chart in each tool is a short note on exactly what the formula is doing, so the numbers are never a black box. The distance, attenuation, and budget tools use exact relationships; the pulse-width tool's dynamic-range and range outputs are a labelled teaching approximation.
In the field
A carrier deployed a 120 km route with 15 fusion splices and 6 connectors and tested it bidirectionally at 1310 nm and 1550 nm with 500 m launch and receive fibers, a 100 ns pulse, and three-minute averaging. The first pass flagged a splice at 40 km reading 0.35 dB against a 0.1 dB specification, plus two connectors above 0.5 dB from contamination. The contractor re-fused the splice to 0.06 dB and cleaned the connectors back to 0.3 dB, bringing the total to 27.2 dB inside a 28 dB budget. The build was accepted with full documentation — the trace caught the problems before service ever ran over them.
A 50 km data-centre interconnect that had run clean for three years began throwing intermittent errors as the link drifted to the edge of receiver sensitivity. Comparing a fresh trace against the installation baseline showed the fiber attenuation unchanged at 0.21 dB/km, but a connector at 0.5 km had risen from 0.3 dB to 0.8 dB and a new bend signature at 22 km added 1.2 dB — 1.7 dB of extra loss in total. A site visit found a concrete barrier a construction crew had set against the buried conduit, stressing the fiber. Removing it and re-terminating the connector returned the link to within 0.2 dB of baseline. The baseline is what made the diagnosis quick.
Before committing to 100G coherent over a 15-year-old 400 km dark-fiber route, an operator characterized it at 1550 nm with a 300 ns pulse and measured link ORL. The fiber averaged 0.24 dB/km with a link ORL of 42 dB — healthy for DWDM — while one 10 km section ran elevated at 0.32 dB/km and was earmarked for extra amplification. Amplifier sites fell out at roughly 80 km intervals from the measured span losses, and the deployed system met its target OSNR above 18 dB on every channel. Setting amplifier output and per-channel launch from measured span loss is the same discipline covered in composite versus per-channel power for OSNR, and the amplifier spacing logic mirrors that of long-haul repeater placement on undersea systems.
Takeaway: The recurring theme across all three is the baseline. A trace on its own tells you the state today; a trace compared to a saved baseline tells you what moved, and that comparison is what turns hours of fault-hunting into a drive to a known kilometre marker.
Main Points
- An OTDR maps a whole link from one end by timing backscatter and reflections; distance comes from d = (c·t) / (2n).
- Rayleigh backscatter is the continuous sloping baseline and reads about -80 dB at 1550 nm for a 1 ns pulse; Fresnel reflections are the discrete spikes, around -14.5 dB at a glass-air interface.
- Set the IOR to the fiber's group index — a 1% error is a 1% distance error.
- Return loss is positive and you want it large; reflectance is negative and you want it deeply negative. They describe the same interface.
- Dead zones limit detection and measurement near reflections; launch and receive fibers move them out of the link under test.
- Pulse width trades resolution for reach: a 100 ns pulse resolves about 10 m and reaches far; a 3 ns pulse resolves 0.3 m but not far.
- Bidirectional averaging is required for true splice loss and removes false gainers from backscatter and mode-field-diameter mismatch.
- Clean and inspect every end-face; contamination is the most common cause of high loss and high reflection.
- Dynamic range sets maximum testable length — 30–40 dB covers most terrestrial routes; long-haul needs more.
- Save a baseline trace; later comparison is what makes fault location and acceptance verification fast.
References
- ITU-T G.650.3 — Test methods for installed single-mode optical fibre cable links, ITU-T Study Group 15.
- IEC 61746-1 — Calibration of optical time-domain reflectometers (OTDR), International Electrotechnical Commission.
- Telcordia GR-196-CORE — Generic Requirements for Optical Time Domain Reflectometer (OTDR) Type Equipment, Telcordia Technologies.
Sanjay Yadav, "Optical Network Communications: An Engineer's Perspective" — Bridge the Gap Between Theory and Practice in Optical Networking.
Developed by MapYourTech Team
For educational purposes in Optical Networking Communications Technologies
Note: This guide is based on industry standards, best practices, and real-world implementation experiences. Specific implementations may vary based on equipment vendors, network topology, and regulatory requirements. Always consult with qualified network engineers and follow vendor documentation for actual deployments.
Feedback Welcome: If you have any suggestions, corrections, or improvements to propose, please feel free to write to us at [email protected]
Related Articles on MapYourTech