Cost per Kilometer: Hollow-Core Against SMF Builds
Fiber cable is a minority line item in an outside-plant budget once civil works, splicing and transceivers are counted, and that changes how a hollow-core premium reads across intra-data-center, campus, metro, fronthaul and access builds.
Add a degree today or dig a trench tomorrow.
1. Introduction
Anti-resonant hollow-core fiber (AR-HCF) traded at roughly $3,000–5,000 per fiber-kilometer in mid-2026, against roughly $10–15 per kilometer for a bulk-procured 24-fiber loose-tube ITU-T G.652.D cable (both analyst estimates). Quoted that way the ratio runs into the hundreds, and most procurement conversations end there. They end one step too early, because no operator buys fiber. Operators buy routes, and a route carries a trench, a duct, a permit, a splice crew, a set of joint enclosures and two ends of terminal equipment before any glass is paid for.
Once those items enter the same spreadsheet, the arithmetic shifts. Trenching, ducting, permitting and surface restoration account for 60–80% of outside-plant capital cost (published infrastructure-economics reviews), and a trench costs the same whether the duct ends up holding solid-core or air-core fiber. On a 40 km metro build at moderate civil-works cost, the hollow-core premium on the total budget is around 12%, not the 600-fold gap the cable line shows. In a data center, where there is no trench at all, the fiber share climbs back toward half the budget and the premium applies close to in full.
This article models route cost per kilometer across five deployment cases — intra-data-center, campus DCI, metro DCI, 5G fronthaul and PON access — states the arithmetic that produces each figure, and then tracks how the individual components move as manufacturing yield, cable design, connectors, splicers and test tooling mature. Every cost figure carries its evidence class, because the published numbers come from three different bases and are routinely compared as though they came from one.
2. Route Cost per Kilometer: Definition and Component Terms
Route cost per kilometer is the total capital cost of building one optical route divided by its length in kilometers. It sums four items: cable, splices and connectors, civil works, and terminal transceivers. Route cost per kilometer is a property of the build, not a property of the fiber, and it is quoted in dollars per kilometer.
Fiber Price, Cable Price and Route Cost
Fiber price per fiber-kilometer prices one strand over one kilometer. It is the number analysts quote for hollow-core, and in mid-2026 it sat at roughly $3,000–5,000 (analyst estimate). Cable price per route-kilometer prices the finished cable that goes in the duct, and it scales with fiber count: a 24-fiber cable costs roughly 24 times the per-fiber figure in fiber content alone, plus the cabling itself. Route cost per kilometer adds everything else the build pays for. The published $5,000–10,000 per kilometer quoted for low-fiber-count production AR-HCF cable in 2024–2025 and the $3,000–5,000 per fiber-kilometer quoted for 2026 are stated on different bases, and comparing them directly overstates or understates the trend depending on which way the error falls. The same basis problem explains why published hollow-core-to-SMF price ratios range from roughly 50:1 to roughly 600:1 without any of them being wrong: the low end compares finished cable against a per-fiber-metre commodity price, the high end compares a low-fiber-count hollow-core cable against a 24-fiber loose-tube cable. This article uses the second basis throughout, because a build buys cable rather than strands.
Two further separations matter. Capital cost is not ten-year cost of ownership: operating expenditure runs 15–25% of total cost of ownership over a ten-year horizon for outside-plant deployments (published estimate), and it carries the transceiver power differential, maintenance labor and consumables. And a greenfield build is not a brownfield upgrade. In greenfield, civil works are incurred regardless of fiber choice, so the incremental cost of choosing hollow-core is the cable differential alone. In brownfield, the existing duct already holds SMF, so a hollow-core upgrade must justify the full replacement cost including a second pass of civil work.
C_route = ( C_cable x L  +  N_s x c_s  +  N_c x c_c  +  C_civil x L  +  2 x N_ch x c_xcvr ) / L

fiber share  f = C_cable / C_route
Where:
- C_route — route cost per kilometer, $/km
- C_cable — cable price per route-kilometer, $/km. Typical: $10–15 for 24-fiber G.652.D in bulk; $5,000–10,000 for low-fiber-count production AR-HCF cable
- L — route length, km. Typical: under 2 km intra-data-center, 10–80 km metro DCI
- N_s — splice count, one per drum length (2 km assumed); c_s — cost per splice, $15 SMF against approximately $150 AR-HCF (published estimate)
- N_c — connector count, four for an HCF–SMF transition pair at each route end; c_c — cost per connector, $10 SMF against approximately $200 AR-HCF (published estimate)
- C_civil — civil works per kilometer, $/km. Typical: approximately $5,000 inside a campus, $15,000–35,000 outside plant, $100,000–500,000 urban hard-dig
- N_ch — channel count; c_xcvr — transceiver unit price, $200–400 for 400G direct-detect DR4, $1,500–2,500 for 400ZR-class coherent (market values)
Practical Example — a 40 km metro DCI route costed both ways
Take a greenfield 40 km metro route at $30,000/km civil works, carrying a 40-channel DWDM system, so 80 transceivers across both ends. The hollow-core build uses low-fiber-count AR-HCF cable at $7,500/km with direct-detect DR4 modules at $300 each; the SMF build uses 24-fiber G.652.D at $12.50/km and, because 17 ps/(nm·km) of chromatic dispersion rules out direct detection at this reach, coherent modules at $2,000 each.
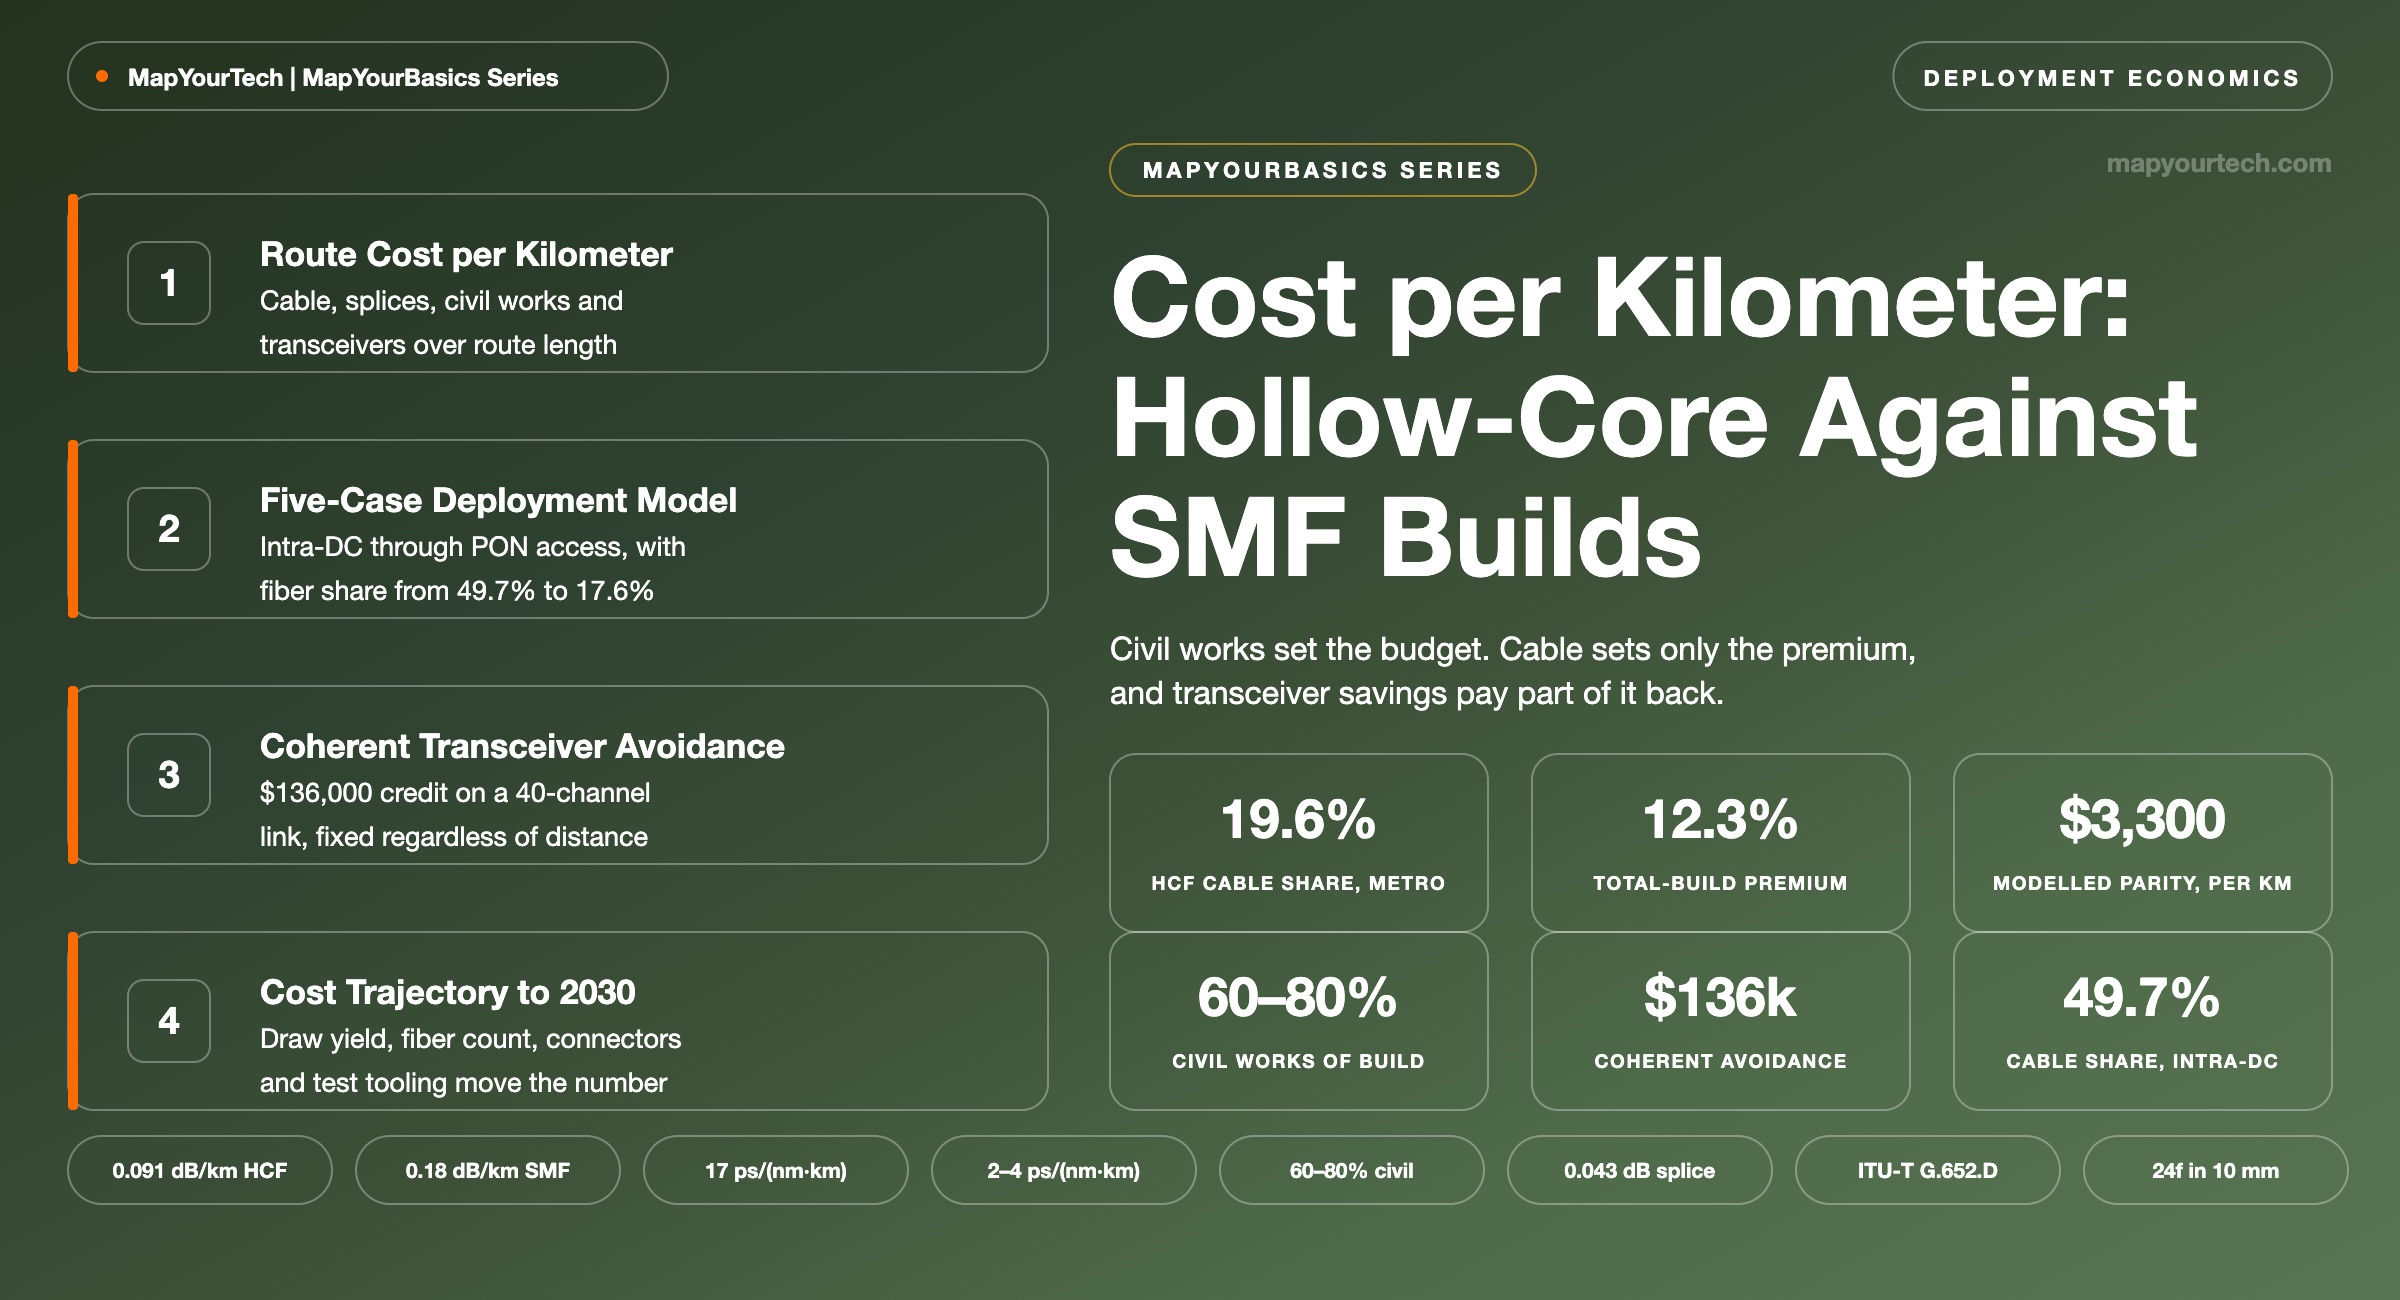
Hollow-core: $300,000 cable + $3,800 splices and connectors + $1,200,000 civil works + $24,000 transceivers = $1,527,800, or $38,195 per kilometer, with cable at 19.6% of the build. SMF: $500 + $340 + $1,200,000 + $160,000 = $1,360,840, or $34,021 per kilometer, with cable at 0.04% of the build. The hollow-core route costs $4,174 more per kilometer, a 12.3% total-build premium, against a cable-line ratio of 600:1.
Takeaway: The fiber-price ratio and the build-cost ratio are different numbers with different denominators. A 600:1 ratio on the cable line becomes a 12.3% premium on the route once a $1.2 M trench and a $136,000 transceiver saving sit in the same budget. Every claim about hollow-core affordability has to name which ratio it means.
3. Build Cost Structure and Component Roles
Trenching, ducting, permitting, surface restoration and the labor around them account for 60–80% of total outside-plant capital cost (published infrastructure-economics reviews), and that share sets the shape of every comparison that follows. Representative ranges run from approximately $5,000/km for soft-dig rural work through $15,000–35,000/km for typical outside plant to $100,000–500,000/km for urban hard-dig with traffic management and full surface reinstatement. At the top of that range, cable of any type falls to 5–10% of the build, and the fiber choice stops being an economic question at all.
Splices, Connectors and Field Labor
An AR-HCF splice costs roughly ten times an SMF splice — approximately $150 against $15, with connectors at approximately $200 against $10 (published estimates). The ratio is a labor and equipment ratio rather than a materials ratio: a hollow-core fusion cycle takes around 100 s against around 35 s for SMF, requires a specialty splicer, and consumes hollow-core-specific mode-field adapters, hermetic sealing and splice sleeves. On a 40 km route at one splice per 2 km drum length, that whole line item still totals $3,800 against $340 — 0.25% of the hollow-core build. Splice cost is an operational constraint on crew productivity long before it is a budget constraint.
Splice performance is no longer the open question. A commercially available AR-HCF field splicer produced 0.043 dB mean hollow-core to hollow-core loss with full yield across 30 trials, and hollow-core to SMF interconnect loss below 0.2 dB has been reported (both measured). A live hyperscale route reported 0.16 dB mean splice loss in the field, with individual splices as low as 0.04 dB (measured).
Terminal Equipment as a Cost Lever
Transceivers are the one line item where hollow-core removes cost rather than adding it. Because AR-HCF carries 2–4 ps/(nm·km) of chromatic dispersion against 17 ps/(nm·km) for G.652, the first dispersion-induced power-fading null moves from about 10 GHz to 20–28 GHz at 40 km (published analysis), which extends direct-detect reach by a factor of four to eight. That keeps a link inside direct-detect DCI territory at distances where SMF forces a move to coherent pluggables, and the resulting transceiver differential is the largest single credit in the hollow-core business case.
Operating Expenditure
Over a ten-year horizon, operating expenditure runs 15–25% of total cost of ownership for outside-plant builds (published estimate), and four items carry it: transceiver power, maintenance labor, one-time technician training on hollow-core fusion procedures, and hollow-core-specific consumables. The power term favors hollow-core through the same mechanism as the capital term. A 400ZR-class coherent module draws 15–18 W against 7–12 W for a direct-detect DR4 (standard-specified and datasheet values), a differential near 7 W per module. At $0.10/kWh over ten years that is $61 per module, or approximately $4,900 across an 80-module 40-channel link — a modest addition to a $136,000 capital saving on the same modules.
Takeaway: Civil works set the size of the budget, cable sets the premium, and transceivers set the offset. Splices and connectors, which attract most of the operational anxiety around hollow-core, contribute under 0.3% of a metro build.
4. Scenario Cost Model: Five Deployment Cases
Five deployment cases separate cleanly by how much civil work each one requires, and the fiber share of total cost follows that separation almost exactly. Intra-data-center runs inside existing containment with negligible civil cost, so cable dominates. Metro DCI, 5G fronthaul and PON all cross public ground, so trenching dominates and cable recedes.
| Deployment case | Route length | Civil works ($/km) | HCF cable share (%) | SMF cable share (%) | Binding constraint |
|---|---|---|---|---|---|
| Intra-data-center | Under 2 km | 5,000 | 49.70 | 0.19 | Cable price; no civil offset |
| Campus DCI | 2–10 km | 5,000 | 26.20 | 0.06 | Cable price; short runs cap absolute cost |
| Metro DCI | 10–80 km | 30,000 | 19.60 | 0.04 | Civil works; coherent avoidance offsets premium |
| 5G fronthaul | Under 20 km | 15,000–35,000 | 22.90 | 0.05 | Brownfield plant; full civil cost on upgrade |
| PON access | Under 40 km | 15,000–35,000 | 17.60 | 0.03 | Splitter architecture multiplies fiber metres |
Intra-data-center links put cable at 49.7% of the build because there is no trench to dilute it, but route length stays under 2 km, so total hollow-core cost per link lands in the $5,000–20,000 band (published model). That is a purchase order rather than a capital program, which is why intra-data-center and campus interconnect are the two cases already justified on ordinary economics rather than on latency premium alone.
PON access sits at the opposite end for a structural reason that has nothing to do with trenching. A passive optical network is point-to-multipoint: one line terminal serves 32–64 subscribers, up to 128 on XGS-PON, through passive splitters. Feeder-fiber cost amortizes across all of them, which helps, but every metre of hollow-core in the distribution and drop segments would be multiplied by the branch count, which does not. The model treats a 20 km feeder and leaves distribution and drop on SMF, and even then hollow-core adoption in access stays unlikely until fiber price approaches parity.
5G fronthaul fails on a different constraint. The links themselves suit hollow-core well — 25–100 Gb/s capacity, tight latency budgets for ultra-reliable low-latency traffic, and cost pressure at scale. But fronthaul is predominantly brownfield, running over installed G.652 in centralized-RAN architectures, with operator surveys attributing roughly 59% of the fronthaul connectivity mix to WDM or dark fiber (industry survey). Replacing that plant means paying the civil-works line a second time, and no fiber-level advantage covers a $15,000–35,000/km re-dig.
Design ruleGreenfield and brownfield produce different answers from the same physics. In greenfield, the decision variable is the cable differential alone, because the trench is a sunk requirement either way. In brownfield, the decision variable is the entire build, and hollow-core has to beat an asset that is already in the ground and already paid for.
Takeaway: Fiber share tracks civil-works intensity inversely, from 49.7% inside a data center down to 17.6% on an access feeder. The cases where hollow-core is cheapest to justify are the ones where its cost share is highest, because those routes are short.
5. Coherent Transceiver Avoidance and Offsetting Savings
Chromatic dispersion of 17 ps/(nm·km) in G.652 fiber caps direct-detect PAM4 reach near 10 km at 400 Gb/s, and beyond that the alternative is coherent detection at $1,500–2,500 per module against $200–400 for a direct-detect DR4 or FR4 (market values). The differential of $1,000–2,000 per module is the largest single number in the hollow-core business case, and it scales with channel count rather than with route length.
On a 40-channel DWDM link with transceivers at both ends, 80 modules at a $1,700 differential aggregate to more than $136,000 per link. That figure does not depend on route length, and the consequence is a two-sided boundary: the transceiver saving is fixed while the fiber premium grows linearly with distance, so there is a route length beyond which hollow-core stops paying for itself and a channel count below which it never starts. Both boundaries are computable from the same expression in Section 2.
The crossover for the 40 km metro case sits at approximately $3,300 per route-kilometer of AR-HCF cable, at which point cable is 9.8% of the build (derived from the model in Section 2). Above that price the hollow-core route costs more; below it, the same route costs less than its SMF equivalent while still carrying cable roughly 260 times the price of G.652.D per kilometer.
Two effects sit on top of that crossover and both favor hollow-core. Amplification density falls, because 0.091 dB/km operational loss lets light travel approximately 33 km before amplification against 15–20 km on standard fiber at 0.2 dB/km (measured and typical values), which removes in-line amplifier sites and their power, huts and maintenance from long routes. And nonlinear headroom widens: an effective nonlinearity roughly 1,000 times lower than silica permits launch powers of +10 to +20 dBm, worth 7–17 dB of additional link budget (published analysis) that a designer spends on span length rather than on equipment. That launch-power headroom follows from the same low overlap between the guided mode and the glass.
Modulation format sensitivityThe saving disappears if the link would have run coherent regardless. On routes where IP over DWDM is the target architecture and coherent pluggables sit in router faceplates for reasons of operational model rather than reach, hollow-core delivers latency and nonlinear headroom but no transceiver offset, and the premium returns to its full value.
Takeaway: Coherent avoidance is worth more than $136,000 on a 40-channel metro link, fixed regardless of route length. That fixed credit against a distance-proportional premium is what sets the crossover at approximately $3,300 per route-kilometer for a 40 km build.
6. Cost Trajectory: Today, Near Term, and Beyond 2030
Hollow-core fiber priced at roughly $3,000–5,000 per fiber-kilometer in mid-2026 (analyst estimate), with manufacturing yield near 10% against above 95% for standard fiber (analyst estimate), and with connectors, test sets and splicing equipment still specific to each supplier's own product. Those three facts are one fact: the price is a yield-and-volume price, not a materials price. Air costs nothing, and the silica in a hollow-core preform costs no more than the silica in a solid one. What is expensive is holding a nested antiresonant microstructure to sub-micron tolerance over a continuous draw of tens of kilometers, and then discarding most of what comes off the tower.
Today: Price Position and Deployment in 2026
Deployment is real and narrow. One hyperscale operator carries live traffic over more than 1,280 km of hollow-core with zero field failures and 0.091 dB/km measured operational loss, against a stated target of 15,000 km by late 2026 (vendor disclosure). A second hyperscaler has begun production deployments across roughly ten data-center sites (vendor disclosure). Financial-exchange routes in Europe run production traffic on 40 km end-to-end spans without mid-span amplification. Publicly disclosed builds fall between 10 km and 40 km, and the occasional 200 km figure is a trial rather than a commercial route (analyst characterization). Buyers are hyperscalers interconnecting AI clusters and trading firms buying microseconds, both of which price latency directly.
Near Term: Four Levers on Cost per Kilometer
Four developments through 2026 attack cost per kilometer from different directions, and none of them is a fiber-price announcement.
Fiber count per cable. A 24-fiber hollow-core cable in a 10 mm diameter has been manufactured to customer attenuation requirements, and high-density cable jetted into microduct at up to 350 ft/min in qualification testing (vendor disclosure, 2026). Fiber count is the lever that converts a fiber-kilometer price into a route economics: one trench, one duct, one crew, 24 services. Installation speed matters for the same reason — jetting rate is a labor rate, and labor sits inside the 60–80% civil-works block rather than the cable block.
Connectors moving to series production. A mode-converting hollow-core connector that transforms the air-core mode to standard SMF LC/UPC and LC/APC interfaces entered series production in 2026, alongside qualified ruggedized outside-plant and inside-plant cable designs (vendor disclosure). Commodity MPO and LC parts for hollow-core still do not exist, and laboratory demonstrations sit at 0.1–0.3 dB insertion loss, but a connector in series production is the difference between a bespoke build and a catalogue item.
Test and certification. A long-range bidirectional hollow-core test and certification platform was released in January 2026, validated with three hyperscale operators, fiber manufacturers and specialist contractors (vendor disclosure). Hollow-core backscatter sits more than 40 dB below silica-core fiber, which breaks conventional OTDR acceptance practice and, until now, forced custom instrumentation onto every project.
Second and third sources. Volume manufacturing agreements with two established preform and fiber producers, a dedicated production line at a third, and a Chinese platform launched at MWC Barcelona 2026 reporting 0.04 dB/km laboratory attenuation all point the same way. Estimated global annual production sits in the low tens of thousands of kilometers, with manufacturers targeting hundreds of thousands (published estimate), and one merchant supplier booked a $40 million hyperscaler contract in August 2026 alongside a $22 million funding round (vendor disclosure). Multi-source supply is what turns a negotiated price into a market price.
Beyond 2030: Projected Price and Parity Timing
Published projections put hollow-core unit cost at approximately $1,000–2,000/km by the end of the decade, eventually approaching parity with premium specialty solid-core fibers rather than with commodity G.652 (published estimate, explicitly uncertain). A commodity-research view stated in 2026 disagrees on timing rather than direction: parity with standard fiber is not anticipated within ten years, and hollow-core remains a premium product, with integration into data center network design from the outset plausible after 2030 once manufacturing cost falls and standards mature (analyst view).
Both positions are compatible with the same arithmetic, and the arithmetic is what an operator should plan against. At $1,500/km cable and a splice cost that has narrowed toward SMF practice, the 40 km metro build from Section 2 totals $1,285,900 against $1,360,840 for the SMF equivalent — hollow-core comes out 5.5% cheaper on total build cost, because the $136,000 coherent-avoidance credit exceeds the $59,500 remaining cable premium. Parity on the fiber line is not required for parity on the route, and the crossover sits between the $7,500 per route-kilometer used for today’s build and the $1,000–2,000 projected for the end of the decade.
| Line item | HCF 2026 ($) | HCF 2030 projected ($) | SMF ($) |
|---|---|---|---|
| Cable, 40 km | 300,000 | 60,000 | 500 |
| Splices and connectors | 3,800 | 1,900 | 340 |
| Civil works, 40 km | 1,200,000 | 1,200,000 | 1,200,000 |
| Transceivers, 80 modules | 24,000 | 24,000 | 160,000 |
| Total build | 1,527,800 | 1,285,900 | 1,360,840 |
| Per route-kilometer | 38,195 | 32,148 | 34,021 |
| Against SMF (%) | +12.3 | −5.5 | — |
That projection assumes cable at $1,500/km, the midpoint of the published range, and splice cost halved to $75 as dedicated splicers and trained crews narrow the labor ratio. Civil works and transceiver counts stay fixed, because neither depends on fiber technology. Treat the third column as a sensitivity rather than a forecast: substitute a different cable price into the expression in Section 2 and the crossover moves with it.
Takeaway: Cost per kilometer falls through cable design, connectors, test tooling and second-source supply before it falls through fiber price. On a civil-works-dominated metro route, hollow-core reaches total-build parity at approximately $3,300 per route-kilometer — between the $7,500 assumed for today’s build and the $1,000–2,000 projected for 2030, which places it inside the reach of near-term manufacturing scale-up.
7. Standards, Supply Chain, and Deployment Tooling
Anti-resonant hollow-core fiber has no G.65x-class recommendation, so every manufacturer's geometry, mode-field diameter and attenuation specification stands on its own. ITU-T Study Group 15 is progressing a technical report on hollow-core fibres through Question 5, harmonized with IEC SC 86A on definitions and test methods; CCSA has an approved hollow-core test-method project. A technical report is not a product specification, and the historical pattern for a new fiber class puts a first recommendation two to four years out from the point at which the parameter set is agreed.
Interoperability is the practical consequence. Without a common mode-field and geometry specification, a hollow-core route procured from one supplier cannot be spliced mid-life to a second supplier's fiber with a predictable loss budget, which forces single-vendor plant on assets that are expected to run for twenty-five years. That is a procurement risk before it is a technical one, and it is the reason most publicly disclosed builds are single-supplier end to end.
Tooling has moved further than standards. A field splicer for AR-HCF is commercially available, mode-converting connectors are in series production, hollow-core-specific test and certification instrumentation shipped in 2026, and cable designs are qualified for outside-plant and inside-plant use. Against a published six-dimension readiness assessment, splicing and deployment tools now score mid-range, while fiber cost, connector availability and manufacturing volume remain the constrained dimensions (published qualitative assessment).
| Lever | State in 2026 | What moves it |
|---|---|---|
| Draw yield | Near 10%, against above 95% for standard fiber (analyst estimate) | Process automation, larger preforms, longer continuous draws |
| Supply sources | Small number of production sites; second and third sources entering volume manufacture | Additional qualified plants and genuine multi-vendor supply |
| Cable fiber count | 24 hollow-core fibers in a 10 mm cable demonstrated (vendor disclosure) | Higher counts amortize fiber cost across more services per route |
| Connectors | Mode-converting connector in series production; no commodity MPO or LC parts | Standardized ferrule and mode-adapter interfaces |
| Splicing | Field splicer available; 0.043 dB mean HCF–HCF loss (measured) | Shorter cycle time and broader technician training |
| Test and acceptance | Long-range bidirectional test platform released (vendor disclosure) | Agreed test methods and acceptance limits across vendors |
| Standards | ITU-T SG15 technical report in progress; IEC SC 86A work ongoing | A G.65x-class recommendation enabling multi-vendor plant |
Takeaway: Splicing and test tooling have largely caught up; connector commoditization, manufacturing volume and a fiber specification have not. Those three set the pace at which cost per kilometer falls, and only the third of them is outside any single manufacturer's control.
8. Conclusion
Civil works set the size of an outside-plant budget and cable sets only the premium on it. That single structural fact converts a 600:1 ratio on the fiber line into a 12.3% premium on a 40 km metro route, and it inverts entirely inside a data center, where cable reaches 49.7% of a build that has no trench to dilute it. Any comparison that quotes a fiber-price ratio without naming the civil-works cost of the route it applies to is describing a purchase order rather than a build.
Three numbers govern the decision. Coherent-transceiver avoidance is worth more than $136,000 on a 40-channel metro link and does not scale with distance. Total-build parity on that route arrives at approximately $3,300 per route-kilometer of hollow-core cable, between the $7,500 assumed today and the $1,000–2,000 published for 2030. And the levers that reach that price are cable fiber count, connector commoditization, test tooling and second-source supply, all of which moved measurably during 2026 while the headline fiber price moved comparatively little.
Model the incremental cost rather than the ratio. In greenfield, the decision variable is the cable differential against the transceiver credit, and on a channel-dense metro route the credit is already the larger of the two at 2030 pricing. In brownfield, the second trench dominates everything else. The DCI distance class and the latency budget of the framing and FEC stack set which case a route falls into, and the physics of guiding light in air sets whether the fiber delivers on it.
References
- ITU-T G.652 — Characteristics of a Single-Mode Optical Fibre and Cable, ITU-T Study Group 15.
- ITU-T Study Group 15 — Executive Summary and Meeting Outcomes, International Telecommunication Union.
- OIF Implementation Agreement — 400ZR, Optical Internetworking Forum.
- IEC SC 86A — Fibres and Cables, International Electrotechnical Commission.
- Broadband Optical Fibre with an Attenuation Lower than 0.1 Decibel per Kilometre, Nature.