Dark Fiber Acceptance Testing: The Checklist Before You Sign
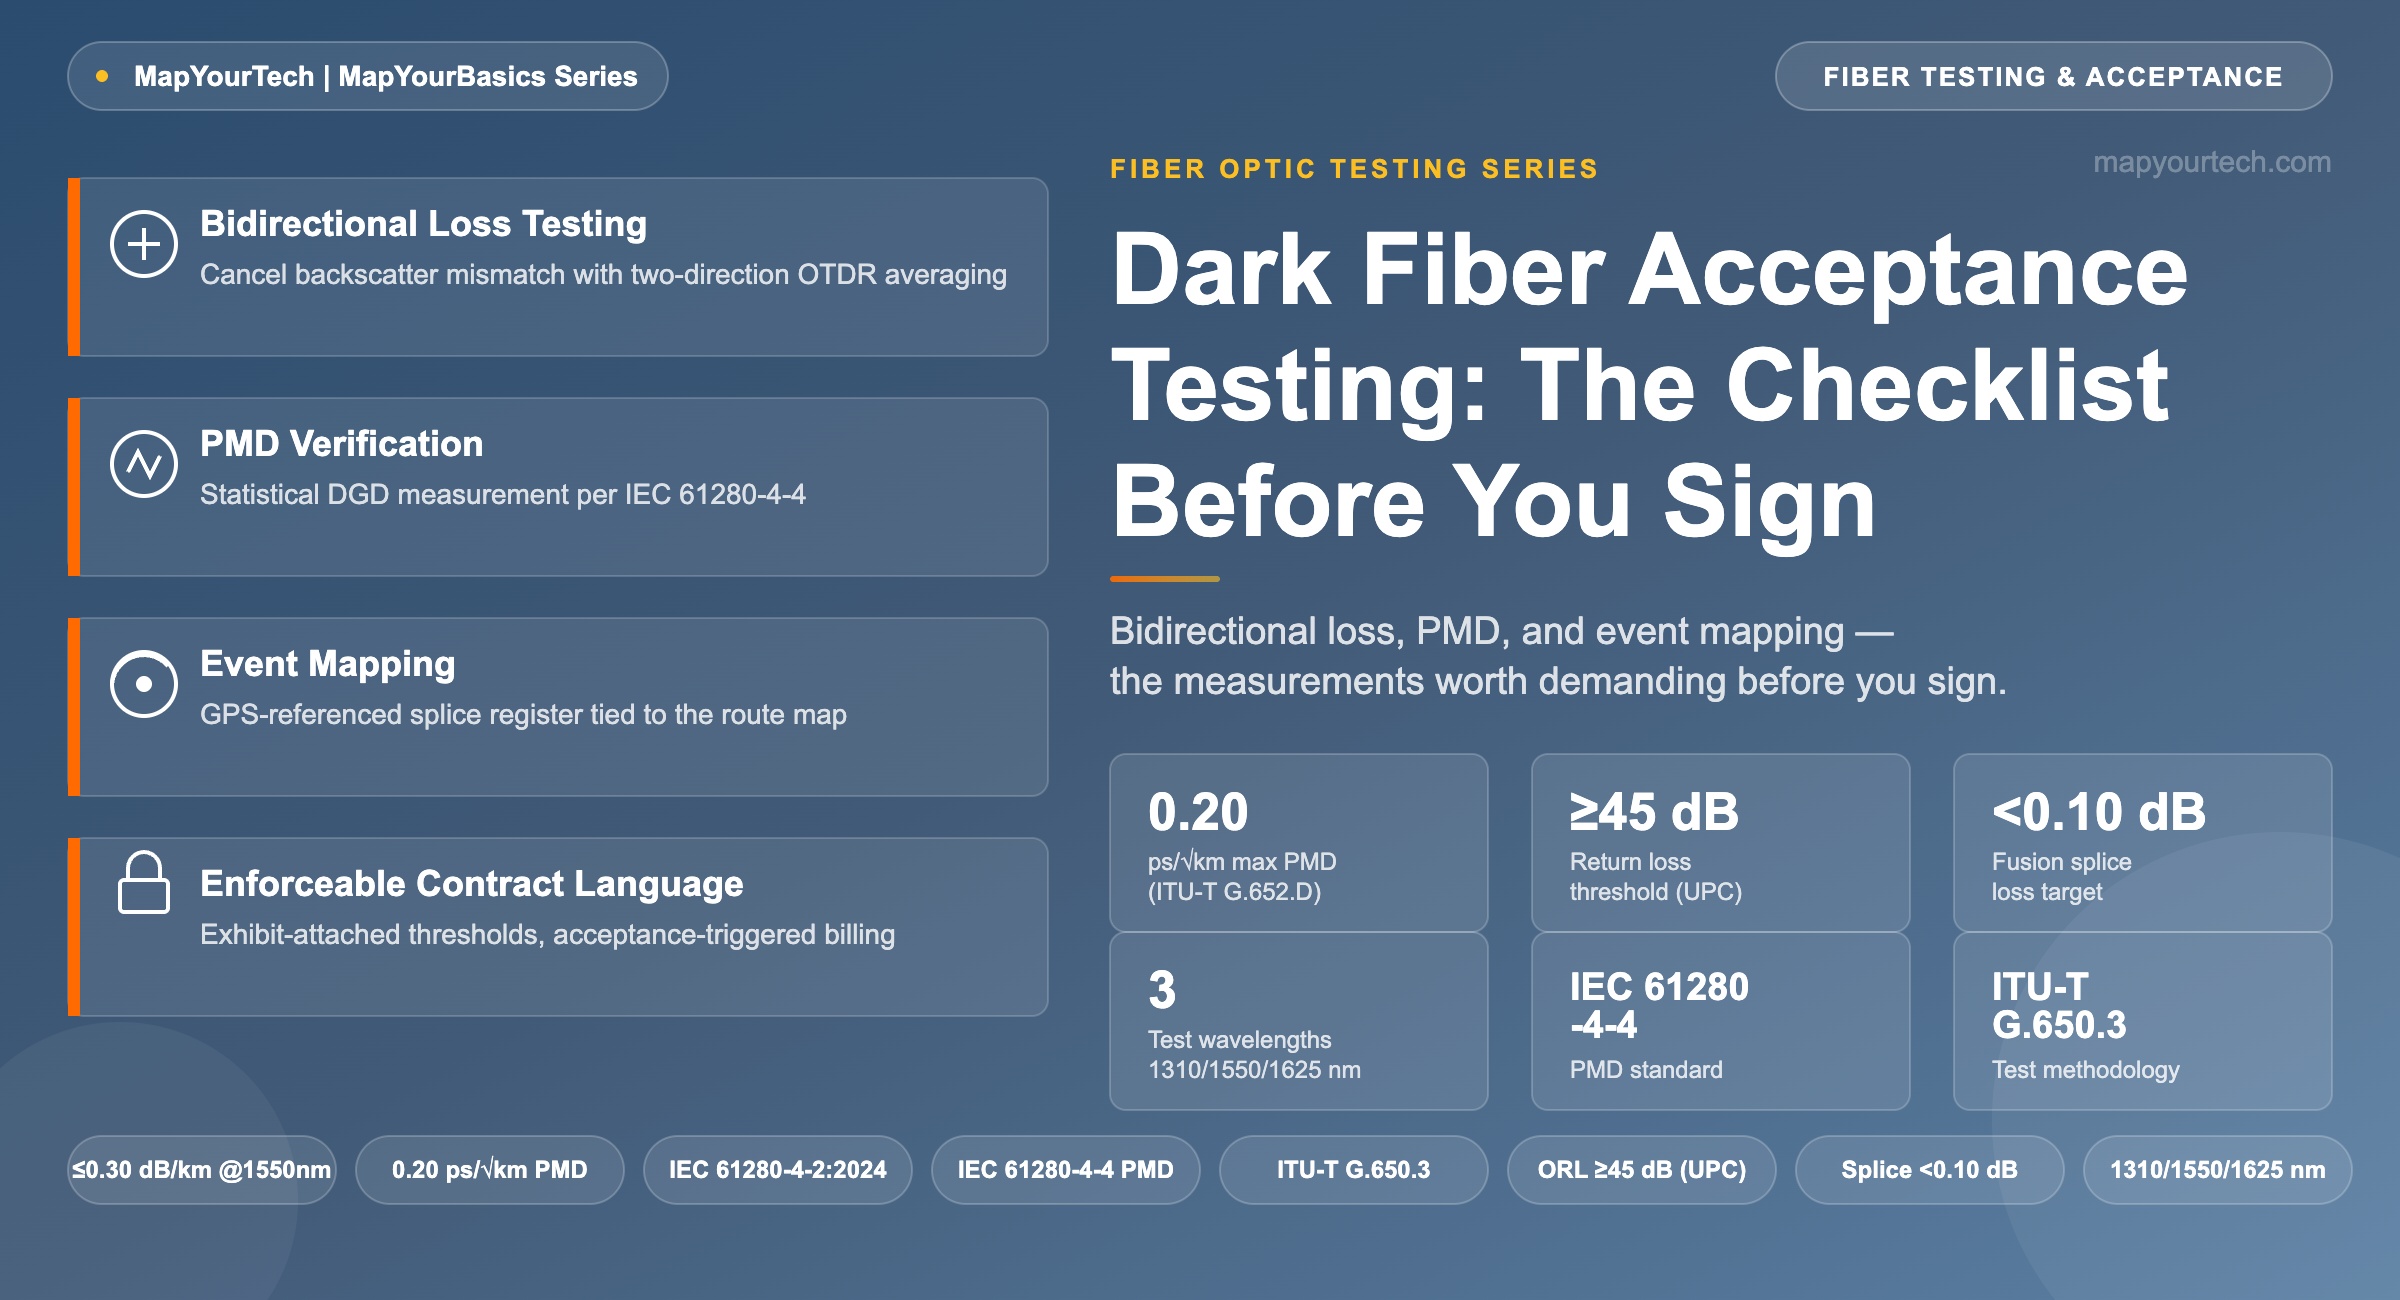
The measurement set worth demanding before accepting leased dark fiber — bidirectional loss, PMD, and event mapping — and the contract language that makes results enforceable.
1. Introduction
A dark fiber IRU or lease closes on a spec sheet: route distance, fiber count, an attenuation coefficient copied from the cable datasheet, maybe a polarization mode dispersion (PMD) line item nobody on the deal team fully reads. The network that actually carries traffic is the fiber in the ground, not the fiber on the datasheet, and the gap between the two rarely shows up at handoff — it shows up eighteen months later, under load, during a coherent upgrade the original deal never anticipated.
Acceptance testing is the one point in the transaction where the buyer can still insist the delivered link match the paper it was sold against. Done single-directionally, or skipped in favor of a one-page loss summary from the provider, it turns the first fault into an argument over whose baseline is correct, because neither party holds a certified before-and-after picture of the fiber. This article works through the three measurements that belong in a dark fiber acceptance test — bidirectional insertion loss and optical return loss (ORL), PMD, and OTDR event mapping tied to the physical route — and the contract language that converts a test report from a courtesy attachment into an enforceable acceptance baseline.
2. Core Concepts: What Acceptance Testing Actually Certifies
Dark fiber acceptance testing is the measurement and documentation process that establishes the certified condition of a leased or purchased fiber route at the moment of handoff. It is not the same exercise as a datasheet compliance check. A cable datasheet describes the fiber as manufactured; acceptance testing describes the fiber as installed — after trenching, splicing, hauling through conduit, and however many years it has sat in the ground before this particular lease. Optical time-domain reflectometry (OTDR) is the core tool: it injects optical pulses into the fiber and times the Rayleigh backscatter and Fresnel reflections that return, converting delay into distance and building a loss-versus-length trace of the entire span.
Four terms carry the discussion. Insertion loss (IL) is the optical power lost as a signal passes a splice, connector, or the fiber itself, in dB. Optical return loss (ORL) is the ratio of reflected power to incident power at a connection point, expressed as a positive dB value where higher is better — it governs laser stability and, at coherent bit rates, receiver noise floor. PMD is the statistical spread in arrival time — differential group delay (DGD) — between the two polarization states of light traveling the same fiber, caused by manufacturing and installation-induced birefringence. Event mapping is the practice of tying every OTDR-detected splice, connector, and anomaly to a physical location on the route — a handhole number, a splice case ID, a GPS coordinate — rather than leaving it as an anonymous distance marker on a trace.
The reason acceptance testing has to be bidirectional, not single-ended, comes down to a measurement artifact rather than a real physical effect. An OTDR infers loss from the change in backscattered power before and after an event. Two fiber sections spliced together rarely have identical backscatter coefficients — different manufacturing lots, different core geometries, sometimes different vendors entirely. Where the coefficient jumps upward across the splice, the trace shows an apparent power increase: a gainer, an event that looks like negative loss. Measured from the opposite direction, the same splice shows the mismatch in reverse, appearing as excess loss. Neither single-direction number is the true value; only the average of the two directions cancels the backscatter-coefficient artifact and reports the splice's actual insertion loss. This is the same backscatter mechanism that sets the practical floor on OTDR-measured ORL over long spans, and it is why any dark fiber acceptance package built from single-direction traces is not a certified measurement — it is a guess with a professional-looking cover page.
Takeaway: Acceptance testing certifies the fiber as installed, not as manufactured, and the certification is only as good as its weakest measurement direction. A single-ended OTDR trace cannot distinguish a real splice loss from a backscatter-coefficient artifact; only bidirectional averaging can.
3. Technical Details: Loss, PMD, and Event Mapping
3.1 Bidirectional Loss and the Link Budget
The industry test methodology for installed single-mode links is ITU-T G.650.3, which defines a tiered set of measurements — a basic tier for commissioning a new link and an advanced tier for service agreements or high-speed transmission, covering attenuation, chromatic dispersion, PMD, and ORL. The attenuation and ORL measurement procedure itself — the one-cord, two-cord, three-cord, and OTDR-based reference methods — is specified in IEC 61280-4-2, now in its third edition (2024), which added an equipment-cord method and refined measurement-uncertainty guidance. Legacy field crews will recognize the older TIA/EIA-526-7 (single-mode) and TIA/EIA-526-14 (multimode) insertion-loss methods, and TIA/EIA-455-107 for return-loss and reflectance measurement; these remain valid procedural references even where IEC 61280-4-2 is the governing acceptance standard. The resulting acceptance number becomes the input to any later power-budget or OSNR calculation for the route, so an inflated or unverified figure here propagates directly into every design decision built on top of it.
L_total = (α_fiber × d) + Σ(L_splice) + Σ(L_connector) + L_margin

Where:
  L_total     = required end-to-end loss budget (dB)
  α_fiber  = fiber attenuation coefficient (dB/km)
  d          = route length (km)
  L_splice   = individual bidirectional-average splice loss (dB)
  L_connector = individual connector-pair insertion loss (dB)
  L_margin   = design and aging margin (dB)
Practical Example — 42 km metro dark fiber route, 1550 nm. Fiber: 0.21 dB/km × 42 km = 8.82 dB (measured, typical field value for G.652.D). Splices: 0.06 dB × 9 = 0.54 dB (bidirectional average, fusion). Connectors: 0.30 dB × 4 pairs = 1.20 dB. Subtotal IL = 10.56 dB. Adding a 2 dB design margin gives a total acceptance threshold of 12.56 dB. A bidirectional OTDR average that returns 11.3 dB passes with 1.26 dB of spare budget — the number the lessee should carry into any future amplifier or coherent-transponder OSNR sizing exercise, not the datasheet figure the deal was quoted against.
L_avg = (L_A→B + L_B→A) / 2

Where:
  L_A→B = event loss measured from end A toward end B (dB)
  L_B→A = event loss measured from end B toward end A (dB)
This cancels the backscatter-coefficient mismatch described in Section 2. It requires physical access to both fiber ends during testing — the reason acceptance testing has to be scheduled as a coordinated two-crew event rather than a single technician walking the route with one OTDR.
3.2 Reading the Gainer: Why Direction Changes the Number
The mechanism behind a gainer is worth seeing rather than just stating. Two fiber sections with different Rayleigh backscatter coefficients — typically because they come from different manufacturing lots or different fiber sub-types — are joined at a splice. Measured from end A, the trace shows the splice as an apparent power increase, because the fiber past the splice backscatters more strongly even though it is not actually amplifying anything. Measured from end B, the same splice shows an exaggerated loss, because now the higher-backscatter fiber is on the near side. Averaging the two directions cancels the coefficient mismatch and leaves the true insertion loss of the joint, which is typically much smaller than either single-direction reading suggests.
3.3 PMD: Statistical, Not Deterministic
PMD is measured per IEC 61280-4-4, which covers cable plants and links rather than individual fiber samples, because PMD is a statistical quantity that must be reported on a link basis, not inferred from a single fiber's factory data. ITU-T G.652.D specifies a maximum PMD link design value of 0.20 ps/√km (standard-specified); modern low-PMD fiber commonly measures well below that in the field, with manufacturers reporting values under 0.06 ps/√km for premium production — a vendor-reported figure, not a guaranteed field result, and one worth confirming on the specific route rather than assuming.
DGD_link ≈ PMD_coef × √L

Where:
  DGD_link = expected differential group delay for the link (ps)
  PMD_coef = fiber PMD coefficient (ps/√km)
  L        = route length (km)
This square-root scaling holds under the statistical mode-coupling regime that applies to installed cable (theoretical limit, derived from Maxwellian DGD statistics), not to a single short uncoupled fiber. Practical Example: a 42 km route with a measured PMD coefficient of 0.06 ps/√km gives DGD ≈ 0.06 × √42 ≈ 0.39 ps — negligible against any practical bit period, including 400G coherent channels, where PMD is compensated electronically in the DSP rather than budgeted as an optical-domain penalty. The engineering rule of thumb for legacy direct-detect systems is to keep statistical DGD under roughly 10% of the bit period for a sub-0.5 dB penalty; a 10 Gbps signal (100 ps bit period) tolerates around 10 ps of DGD before the penalty becomes material.
Watch for: a PMD line that only reports "meets G.652.D" without a measured value. That statement describes the fiber the manufacturer shipped, not the link as spliced and installed. Field workmanship — splice rotation, cable stress, connector alignment — can add measurable DGD that no factory certificate captures.
3.4 Event Mapping: Turning a Trace Into a Locatable Fault
An OTDR trace by itself is a list of distances and loss values. Event mapping is the step that converts each of those distances into a physical location a repair crew can drive to: a splice case number, a handhole ID, a GPS coordinate correlated against the route's as-built map. Reflective events (spikes) generally correspond to connectors or mechanical splices; non-reflective events (steps) generally correspond to fusion splices, bends, or fiber damage. Any event with unexpectedly high reflectance — commonly flagged above roughly -40 dB — is worth a physical inspection before acceptance, because a marginal connector or dirty end-face at handoff is a marginal connector six months into the lease, only now it is buried under a road.
4. Practical Guidelines: The Checklist and the Contract Language
4.1 What to Demand Before Signing
- Bidirectional OTDR traces at three wavelengths — 1310 nm, 1550 nm, and 1625 nm — with the raw .SOR files delivered alongside the summary report, not instead of it. A PDF alone cannot be independently re-analyzed if a dispute arises later.
- An LSPM insertion-loss cross-check per IEC 61280-4-2, independent of the OTDR reading, because OTDR-derived loss and true end-to-end insertion loss can diverge, particularly on short spans with few resolvable events.
- A PMD measurement per IEC 61280-4-4 with a reported numeric value, not a pass/fail statement, especially where a future coherent upgrade is plausible.
- A splice register cross-referenced to the route map by GPS coordinate and unique splice case ID for every OTDR event, matching the event mapping described in Section 3.4.
- Logged test conditions — ambient temperature and date/time at the moment of test — since both attenuation and PMD vary modestly with temperature, and a documented baseline condition removes one axis of dispute during a later re-test.
- End-face inspection records per IEC 61300-3-35 pass/fail criteria for every connector in the path, since contaminated or damaged end-faces are consistently the largest single contributor to excess connector insertion loss in the field. Many of these same thresholds carry forward into the fiber-characterization phase of DWDM system commissioning once the leased route is lit.
4.2 Contract Language That Makes the Numbers Enforceable
A test report only protects the buyer if the contract treats it as the operative definition of what was delivered, rather than as background material. Five clauses do most of the work:
- Attach the acceptance report as a numbered exhibit with explicit numeric thresholds per span — a maximum dB/km, a maximum splice loss, a minimum ORL, a maximum PMD coefficient — rather than a reference to "industry standard" or "manufacturer specification," phrases that leave room for exactly the dispute the testing was meant to prevent.
- Tie commencement of billing and any IRU term start date to the date of signed acceptance, not to the date of physical handoff. A fiber that fails acceptance and requires re-splicing should not be accruing lease payments while it sits out of spec.
- Define a remedy window for any measurement outside the exhibit's thresholds — a fixed number of business days to re-splice, re-clean, or re-terminate, followed by a mandatory retest using the same bidirectional method before re-submission.
- Require retention of the raw trace files for the life of the agreement, with an audit right for either party to re-analyze them, and specify who retains custody of the original .SOR files versus a copy.
- Specify a periodic re-baseline cadence, such as an annual bidirectional OTDR retest, and define what measured delta against the accepted baseline counts as a material degradation triggering a service-level conversation rather than a silent, undocumented drift.
Field note: the acceptance package is also the document a coherent-transponder vendor will ask for during any future capacity upgrade. A route accepted with a full bidirectional dataset and a measured PMD value shortens that qualification cycle considerably compared with a route accepted on a one-page summary and a datasheet reference.
Takeaway: The checklist and the contract clause are two halves of the same protection — a complete measurement set with no enforceable exhibit language still leaves the buyer negotiating from a weak position after handoff, and enforceable language attached to an incomplete measurement set has nothing solid to enforce.
| Parameter | Test Method / Standard | Reference Threshold | Evidence Class |
|---|---|---|---|
| Attenuation, 1550 nm | IEC 61280-4-2 (OTDR or LSPM) | ≤0.30 dB/km max (ITU-T G.652.D); field values commonly 0.19–0.22 dB/km | Standard-specified / measured |
| Attenuation, 1310 nm | IEC 61280-4-2 | ≤0.40 dB/km max (ITU-T G.652.D) | Standard-specified |
| Fusion splice loss | Bidirectional OTDR average | <0.10 dB typical; re-splice if >0.15 dB | Practitioner-typical |
| Connector insertion loss | LSPM one/two/three-cord method | <0.30 dB per mated pair | Practitioner-typical |
| Optical return loss, UPC | TIA/EIA-455-107 or OTDR ORL feature | ≥45 dB (−40 to −50 dB range typical) | Practitioner-typical |
| Optical return loss, APC | Same | ≥55–60 dB typical | Practitioner-typical |
| PMD coefficient (link) | IEC 61280-4-4 | ≤0.20 ps/√km max (ITU-T G.652.D); field values often <0.06 ps/√km | Standard-specified / vendor claim |
| Reflective event flag | Bidirectional OTDR trace | Flag any single event with reflectance above roughly −40 dB | Practitioner-typical |
5. Summary
Dark fiber changes hands on paper, but it is accepted on measurement. A bidirectional OTDR set at three wavelengths, an independent LSPM insertion-loss check, a numeric PMD reading, and an event map tied to the physical route together turn "the fiber meets spec" from a sales claim into a certified, re-testable baseline. None of that protection survives contact with a dispute unless the contract names the exhibit, ties the commercial terms to signed acceptance rather than physical handoff, and defines what happens when a measurement falls short. The routes that avoid the multi-year argument over who broke what are, almost without exception, the ones where both sides walked away from turn-up holding the same raw trace files.
Related Articles on MapYourTech