MapYourTech · MapYourBasics Series
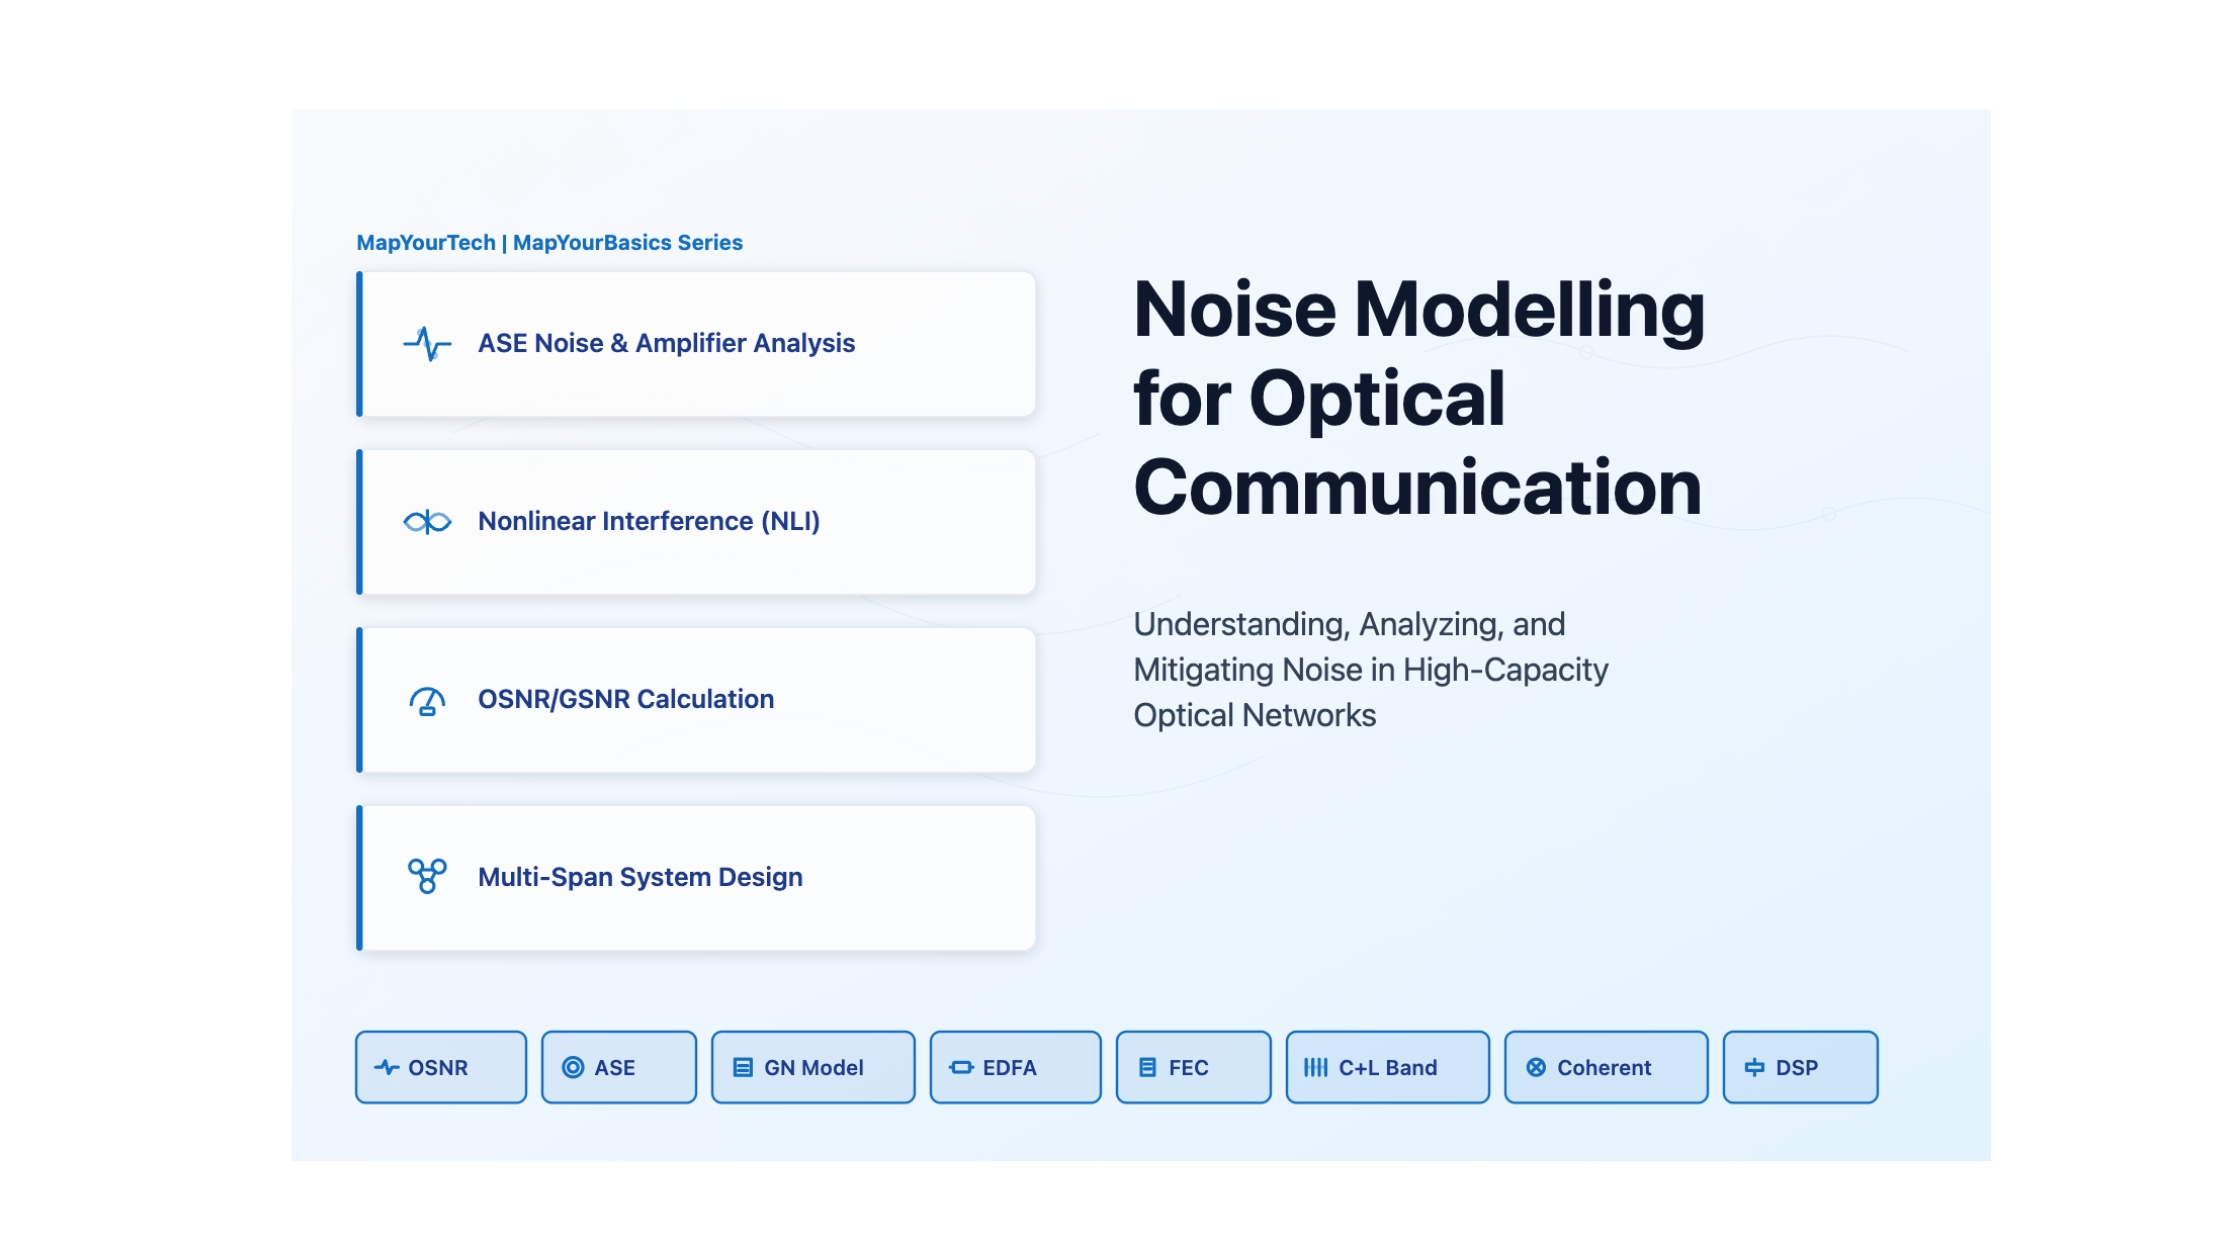
Noise Modelling for Optical Communication
The four noise sources that bound every link — ASE, nonlinear interference, shot, and thermal — and the OSNR and GSNR math that turns them into a reach number.
Introduction
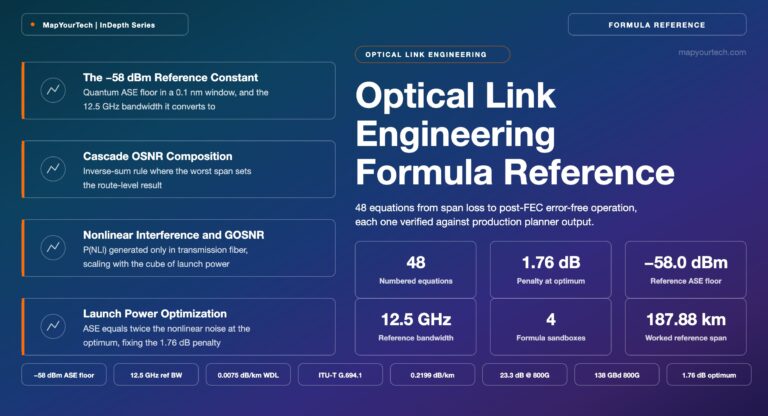
Noise sets the ceiling on every optical link. It is the random fluctuation in signal power, phase, and timing that decides how cleanly a receiver recovers bits, and it comes from four physical mechanisms that behave very differently: amplified spontaneous emission that adds with every amplifier, nonlinear interference that grows with the cube of launch power, shot noise from the discrete arrival of photons, and thermal noise in the receiver electronics. Modelling them is what lets an engineer predict reach and capacity before a single fiber is lit. This guide builds each mechanism from its physics, gives the OSNR and GSNR math that combines them, and provides four calculators to run the budget. The thread running through all of it: ASE accumulates, NLI is cubic in power, and the optimal launch power sits where the two cross.
One metric to carry: the Generalized Signal-to-Noise Ratio (GSNR) combines ASE and NLI into a single feasibility number, GSNR = Pch / (PASE + PNLI). It is the metric modern planning tools compute, because OSNR alone misses the nonlinear half of the problem.
1. Fundamentals and Core Concepts
Where noise comes from
Where modelling decides the outcome
| Scenario | Impact | Key parameters |
|---|---|---|
| Long-haul transmission | ASE accumulates over many amplified spans | OSNR, span loss, amplifier spacing |
| High-capacity systems | NLI caps launch power and spectral efficiency | Channel power, fiber nonlinearity, spacing |
| High-order modulation | Dense constellations need high SNR for low BER | Required OSNR, format, FEC overhead |
| Multiband systems | SRS tilt and band-dependent loss imbalance noise | SRS tilt, band allocation, power management |
Takeaway: Over a 2000 km C+L system with around 50 amplified spans, the difference between an accurate noise model and an optimistic one is the difference between planning for 16 Tb/s and stalling at 8 Tb/s — the model directly sets the business case.
2. Mathematical Framework
OSNR
OSNR (dB) = 10·log₁₀(Psignal / (PSDnoise × Bref))
Psignal is the per-channel power, PSDnoise the noise power spectral density, and Bref the reference bandwidth (12.5 GHz / 0.1 nm).
ASE power from one amplifier
PASE = nsp · hν · (G − 1) · Bo
nsp is the spontaneous-emission factor (1.5–2.5 for EDFAs), G the linear gain, Bo the optical bandwidth.
Per-span and multi-span OSNR (engineering form)
OSNRspan = 58 + Pch − Lspan − NF
OSNRtotal = OSNRspan − 10·log₁₀(N)
Pch is per-channel power (dBm), Lspan the span loss the amplifier overcomes, NF the noise figure, and +58 the bandwidth constant at 1550 nm over 12.5 GHz. The +58 already carries the photon-energy and bandwidth terms — do not also subtract 10·log₁₀(Bref), or the result is wrong by about 100 dB.
GSNR with nonlinear interference
1/GSNR = 1/OSNR + 1/SNRNLI
GSNR = Psignal / (PASE + PNLI)
NLI power spectral density (GN model)
PSDNLI(f) ≈ (16/27) · γ² · P³ · (Leff²/Lspan) · N · g(f)
γ is the nonlinear coefficient (about 1.2 /W/km for SMF, near 0.001 for hollow-core fiber), P channel power, Leff the effective length, N the span count. The cubic P³ dependence is why launch power has a hard optimum — the GN model captures SPM, XPM, and FWM as a single additive Gaussian term once dispersion has decorrelated the signal.
Where the GN model holds: it assumes the WDM signal is statistically Gaussian, which is true once chromatic dispersion has decorrelated the channels — typically within the first one or two spans of an uncompensated coherent link. It degrades for low-dispersion fiber and very low baud rates, where the Gaussian assumption breaks.
3. Types of Noise
Amplified spontaneous emission (ASE)
Broadband, additive, signal-independent, and dominant in amplified multi-span systems. Noise figure runs 4–6 dB for C-band EDFAs and 6–8 dB for L-band. OSNR drops 3 dB per doubling of spans.
Nonlinear interference (NLI)
From the Kerr effect (n = n₀ + n₂|E|²): self-phase modulation broadens the signal spectrum, cross-phase modulation couples channels, and four-wave mixing generates new tones. NLI power scales as P³, so it sets the maximum usable launch power.
Shot noise
ishot² = 2qIphotoBe. The quantum detection floor, more significant in direct-detection systems.
Thermal noise
ithermal² = 4kBTBe/R. Dominant in receiver electronics at low optical power; a low-noise front end or optical pre-amplifier suppresses it.
| Noise type | Spectrum | Power dependence | Mitigation |
|---|---|---|---|
| ASE | Broadband, uniform | Independent of signal | Low-NF amplifiers, shorter spans |
| NLI | Signal-dependent | ∝ P³ | Lower launch power, larger Aeff fiber |
| Shot | White | ∝ √P | Higher optical power |
| Thermal | White | Independent | Low-noise receivers, pre-amplification |
| SRS tilt | Power tilt across bands | ∝ P × Δf | Power pre-emphasis, ASE idlers |
Fiber dependence
4. Effects and Impacts
| OSNR (dB) | Pre-FEC BER | Status | Action |
|---|---|---|---|
| > 20 | < 10-12 | Excellent | Normal operation |
| 15–20 | 10-9–10-12 | Good | Monitor |
| 10–15 | 10-6–10-3 | Marginal | FEC required |
| < 10 | > 10-3 | Poor | Intervention |
Capacity follows the modulation the OSNR supports: at 50 GHz spacing, QPSK (15 dB) gives 100 Gb/s, 16-QAM (21 dB) gives 200 Gb/s, and 64-QAM (28 dB) gives 300 Gb/s — so a 6 dB OSNR loss can cut per-channel capacity by two thirds. Reach follows the 10·log₁₀(N) law: a 1 dB lower noise figure extends reach by roughly 200–300 km in a typical long-haul system.
| Impairment | Primary mitigation | Secondary | Typical gain |
|---|---|---|---|
| ASE | Low-NF amplifiers | Distributed Raman | 2–3 dB |
| NLI | Reduced launch power | Digital back-propagation | 1–4 dB |
| Shot | Higher optical power | Balanced detection | 3–6 dB |
| Thermal | Low-noise TIA | Optical pre-amplifier | 5–10 dB |
5. Interactive Calculators
Four calculators on one consistent model. Simulator 2 is the one to sit with: hold the fiber fixed and sweep launch power, and watch GSNR rise on ASE, peak, then fall as NLI takes over — the optimal launch power is that peak, and on hollow-core fiber it sits far to the right.
6. Techniques and Solutions
Low-NF EDFAs
Gain-flattening filters and optimised erbium length hold NF to 4–5 dB in C-band; each 1 dB of NF is 1 dB of per-span OSNR, so this is the cheapest lever on ASE.
Distributed Raman
A counter-propagating pump roughly 100 nm below the signal gives distributed gain and an effective NF near 0 to −2 dB — 3–5 dB OSNR and meaningful reach extension, at the cost of pump management and power.
Digital back-propagation
Numerically inverting the nonlinear Schrödinger equation recovers 1–4 dB of nonlinear penalty, but the FFT load per span is heavy — reserved for high-value long-haul links.
Forward error correction
Hard-decision RS gives 6–7 dB net coding gain at 7% overhead; soft-decision LDPC reaches 11–12 dB at 20%. FEC is the strongest lever for relaxing the OSNR requirement.
Coherent detection
Capturing amplitude and phase across both polarizations enables DSP compensation of linear impairments and gives 3–6 dB over direct detection.
| Technique | Target noise | Gain | Cost |
|---|---|---|---|
| Low-NF EDFA | ASE | 1–2 dB/span | Medium |
| Raman | ASE | 3–5 dB | High |
| Digital back-propagation | NLI | 1–4 dB | DSP load |
| Advanced FEC | All | 11–14 dB NCG | Medium |
| Coherent RX | All | 3–6 dB | High |
7. Design Methodology
Define capacity, distance, and target pre-FEC BER; set the required OSNR for the format; build the amplifier chain; optimise launch power against NLI; then verify the GSNR budget with margin. The required OSNR is the format threshold plus a 2–3 dB implementation margin.
Practical Example — 1600 km, 80×100G DP-QPSK.
20 spans of 80 km, fiber 0.2 dB/km → span loss 16 dB. Amplifier total output +17 dBm across 80 channels → per-channel +17 − 10·log₁₀(80) = −2 dBm. NF 5 dB.
Per-span OSNR = 58 + (−2) − 16 − 5 = 35 dB.
Receiver OSNR = 35 − 10·log₁₀(20) = 35 − 13 = 22 dB.
Against a 13.5 dB QPSK target (with margin) that is 8.5 dB of headroom — the link closes comfortably. The headroom is also what you would spend to move to 16-QAM (about 21 dB required); there a low-NF amplifier or Raman buys the extra few dB.
Per-channel, not total: the single most common budgeting error here is feeding total amplifier output into the per-channel OSNR formula. For 80 channels at +17 dBm total, the per-channel figure is −2 dBm — 19 dB lower. Use per-channel power, and never subtract a separate bandwidth term on top of the +58 constant.
Pitfalls to avoid
Pitfall: ignoring implementation margin. Fix: add 2–3 dB over the theoretical threshold.
Pitfall: linearising NLI. Fix: use the GN model or measurement, not a fixed dB penalty.
Pitfall: one model for all bands. Fix: model S, C, and L separately — loss and SRS differ.
Pitfall: designing for fresh fiber. Fix: budget 5–10 years of component aging.
Pitfall: under-counting splice loss. Fix: 0.5–1 dB for hollow-core splices, 0.1–0.3 dB for SMF.
8. Applications and Case Studies
Practical Example — 2000 km backbone, 2.5 to 12 Tb/s.
Twenty-five 80 km spans on legacy 6 dB NF EDFAs gave a marginal 11 dB OSNR. Swapping to 4.5 dB NF amplifiers added 1.5 dB, adding C+L doubled the spectrum, hybrid Raman on the worst spans added 2.5 dB, and 16-QAM with 11 dB-NCG soft-decision FEC closed the loop — OSNR reached 15 dB, capacity rose to 12 Tb/s, and cost per bit fell about 75%. C+L expansion beat denser C-band packing on cost.
Practical Example — 200 km hollow-core DCI.
On hollow-core fiber the latency dropped about a third (light travels faster in air) and γ fell roughly 1000×, so NLI vanished as a limit. Running unrepeated at +12 dBm launch (versus 0 dBm on SMF) with coherent receivers and optical pre-amplification, the link carried DP-64QAM at 32 Tb/s with a 22 dB receiver-limited OSNR and no inline amplifiers — ASE accumulation eliminated, splice quality now the dominant concern.
Practical Example — 6000 km submarine, 25-year life.
120 repeaters at 50 km spacing on hybrid Raman+EDFA (effective NF 3.5 dB), low-loss fiber → span loss about 10 dB, per-channel near −1 dBm. Per-span OSNR = 58 − 1 − 10 − 3.5 = 43.5 dB; over 120 spans, 43.5 − 10·log₁₀(120) = 43.5 − 20.8 = 22.7 dB at deployment, falling to about 22 dB end-of-life after aging margin — enough for DP-16QAM. Short low-loss spans are what make the budget close: fewer dB lost per hop means a high per-span OSNR survives the 20.8 dB cascade penalty.
| Symptom | Likely cause | Fix |
|---|---|---|
| OSNR drift over time | Amplifier aging | Check pump power, replace pumps |
| High BER on some channels | Gain ripple | Adjust GFF or per-channel equalisation |
| Power-dependent BER floor | Excessive NLI | Reduce launch power 2–3 dB |
| Band-edge channel failure | Low OSNR or residual CD | Adjust pre-emphasis or DSP |
| All channels degraded equally | ASE buildup | Lower amplifier NF or add Raman |
| Parameter | Typical range | Best practice |
|---|---|---|
| EDFA NF (C-band) | 4–6 dB | ≤ 5 dB |
| EDFA NF (L-band) | 5–8 dB | ≤ 6 dB |
| Launch power (SMF) | −2 to +3 dBm | 0 to +1 dBm/ch |
| Span loss | 15–20 dB | 16–18 dB |
| Receiver OSNR | 12–25 dB | > 15 dB |
Main Points
References
- ITU-T, Optical monitoring for dense wavelength division multiplexing systems (G.697), ITU-T Study Group 15.
- P. Poggiolini et al., The GN-Model of Fiber Non-Linear Propagation and its Applications, Journal of Lightwave Technology.
- ITU-T, Forward error correction for high bit-rate DWDM submarine systems (G.975.1), ITU-T Study Group 15.
Sanjay Yadav, "Optical Network Communications: An Engineer's Perspective" — Bridge the Gap Between Theory and Practice in Optical Networking.
Developed by MapYourTech Team
For educational purposes in Optical Networking Communications Technologies
Note: This guide is based on industry standards, best practices, and real-world implementation experiences. Specific implementations may vary based on equipment vendors, network topology, and regulatory requirements. Always consult with qualified network engineers and follow vendor documentation for actual deployments.
Feedback Welcome: If you have any suggestions, corrections, or improvements to propose, please feel free to write to us at [email protected]
Related Articles on MapYourTech