MapYourTech · InDepth Series
Noise in Optical Systems
Every noise mechanism that bounds an optical link — ASE, nonlinear interference, stimulated Raman scattering, shot, and thermal — with the OSNR and GSNR math, the mitigation toolkit, and four calculators.
Introduction
Noise is the random fluctuation in optical power, phase, and polarization that competes with the signal and decides how far and how fast a link can run. It comes from the quantum nature of light, the spontaneous emission inside amplifiers, the thermal motion of electrons in the receiver, and the Kerr nonlinearity of the fiber. The metric that ties them together is the optical signal-to-noise ratio (OSNR) and, once nonlinearity matters, the generalized SNR (GSNR). This guide builds each mechanism from physics, gives the math that turns it into a reach number, surveys the mitigation toolkit from low-noise amplifiers to probabilistic shaping, and provides four calculators to run the budget.
The cocktail-party picture: a voice across a noisy room competes with background chatter, and as you step back the voice fades while the chatter holds steady. An optical signal is the same — distance weakens it while each amplifier adds noise — until error correction or regeneration is the only way through.
1. Fundamentals and Core Concepts
OSNR is the ratio of average signal power to noise power in a reference bandwidth, conventionally 0.1 nm (about 12.5 GHz). It sets the achievable bit error rate, and through Shannon's theorem it bounds capacity. The four origins:
The economic stake: noise sets reach, rate, and spectral efficiency directly. A noise-limited route needs more regeneration sites, higher transmit power, premium components, and heavier DSP — every one a line on the capital and operating budget.
2. Mathematical Framework
OSNR
OSNR (dB) = 10·log₁₀(Psignal / (PSDnoise × Bref))
ASE power from one amplifier
PASE = nsp · h·f · (G − 1) · Bo
nsp is the spontaneous-emission factor (1.3–2 for EDFAs), G the linear gain, Bo the optical bandwidth. Because PASE scales with (G−1), higher-gain amplifiers add more noise — the reason shorter, lower-loss spans give better OSNR.
Noise figure
NF (dB) = 10·log₁₀(2·nsp)
An ideal amplifier (nsp = 1) reaches the 3 dB quantum limit; EDFAs achieve 4–6 dB, distributed Raman approaches the quantum limit, SOAs run 6–9 dB.
Engineering OSNR (per-span and multi-span)
OSNRspan = 58 + Pch − Lspan − NF
OSNRtotal = OSNRspan − 10·log₁₀(N)
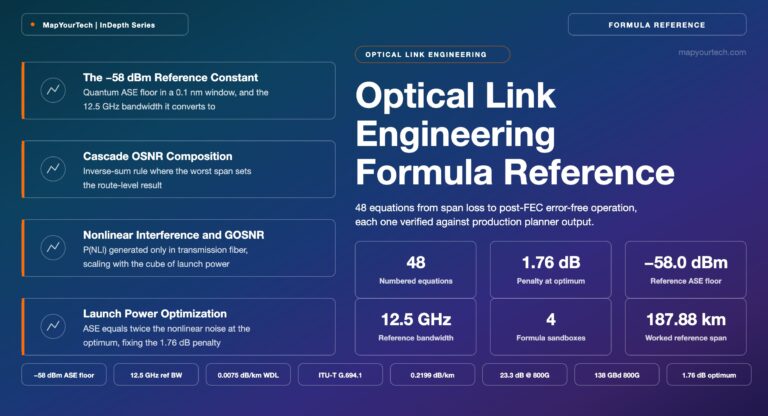
Pch is per-channel power (dBm), Lspan the span loss, NF the noise figure, and +58 the bandwidth constant at 1550 nm over 12.5 GHz — it already carries the photon-energy and reference-bandwidth terms.
Generalized SNR
1/GSNR = 1/OSNR + 1/SNRNLI → GSNR = Psignal / (PASE + PNLI)
Two channels at identical OSNR can have very different GSNR if one carries more nonlinear interference — which is why modern planning tools compute GSNR, not OSNR alone.
Practical Example — OSNR over three 80 km spans.
Per-channel launch +3 dBm, fiber 0.2 dB/km → span loss 16 dB, EDFA NF 5 dB.
Per-span OSNR = 58 + 3 − 16 − 5 = 40 dB.
After three spans: 40 − 10·log₁₀(3) = 40 − 4.8 = 35.2 dB — comfortably above any format requirement.
This is why the OSNR reference bandwidth matters: computing ASE over the full amplifier bandwidth instead of the 0.1 nm reference understates OSNR by roughly 30 dB and turns a healthy link into an apparent failure. The reference is 12.5 GHz, and the +58 constant already carries it. A three-span link does not approach the OSNR floor; reaching it takes tens of spans.
Shannon-Hartley capacity
C = B · log₂(1 + SNR)
Capacity grows only logarithmically with SNR, so doubling SNR adds a single bit per symbol — the reason spectral-efficiency gains get progressively harder and today's systems sit within 1–2 dB of the limit.
3. Types of Noise
| Noise type | Origin | Behaviour | Impact |
|---|---|---|---|
| ASE | Optical amplifiers | Broadband, accumulates per amplifier | Very high |
| NLI | Fiber Kerr effect (SPM, XPM, FWM) | Power and distance dependent | High in dense WDM |
| SRS | Stimulated Raman scattering | Spectral tilt, inter-band power transfer | Very high (wideband) |
| Shot | Quantum photon detection | Fundamental, ∝ √P | Moderate to high |
| Thermal | Receiver electronics | Temperature dependent | Low to moderate |
Amplified spontaneous emission
Pump photons excite erbium ions; some decay by stimulated emission (coherent gain, wanted) and some spontaneously (random photons amplified along the fiber, the ASE noise). It spans the amplifier gain band, adds in both polarizations, scales with gain not signal, and accumulates linearly across a cascade. The double penalty in long-haul: as fiber loss drops the signal, amplifiers raise gain to restore it, and higher gain means more ASE — numerator down, denominator up. At the receiver, signal-ASE beat noise dominates and cannot be filtered electrically.
Nonlinear interference
The Kerr effect makes the index n = n₀ + n₂I, with n₂ ≈ 2.6×10⁻²⁰ m²/W — tiny, but decisive over thousands of kilometres at watts of aggregate power.
The Gaussian Noise model treats the sum of these as additive Gaussian noise once dispersion has decorrelated the channels — the assumption behind GNPy and most planning tools. It holds for many-channel, high-dispersion links and degrades for low-dispersion fiber and very low baud rates.
Stimulated Raman scattering
SRS transfers power from short to long wavelengths through interaction with silica phonons, peaking near a 13 THz shift. In a single C-band it is a 1–2 dB tilt; across S+C+L bands (about 15 THz) it becomes transformative — cumulative tilt can exceed 10 dB, short-wavelength channels lose several dB beyond fiber loss, and long-wavelength channels receive unwanted gain. The effect is dynamic: adding or dropping channels reshapes the power distribution across all of them. Managing it needs per-channel pre-emphasis (launch S-band higher, L-band lower), ASE idler channels to stabilise the tilt during add/drop, and joint optimisation of the whole spectrum rather than band by band.
Shot and thermal noise
4. Effects and Impacts
| OSNR (dB) | Pre-FEC BER | Status | Action |
|---|---|---|---|
| > 20 | < 10-12 | Excellent | Normal operation |
| 15–20 | 10-9–10-12 | Good | Monitor |
| 10–15 | 10-6–10-3 | Marginal | FEC required |
| < 10 | > 10-3 | Poor | Intervention |
Capacity tracks the modulation the OSNR supports, and each step up the constellation costs roughly 3–4 dB: at 50 GHz spacing, QPSK carries 100 Gb/s, 16-QAM 200 Gb/s, and 64-QAM 300 Gb/s — so a 6 dB OSNR loss can drop a channel by two thirds. Reach follows the 10·log₁₀(N) law, and a 1 dB lower noise figure extends a typical long-haul link by roughly 200–300 km.
| Impairment | Primary | Secondary | Typical gain |
|---|---|---|---|
| ASE | Low-NF amplifiers | Distributed Raman | 2–3 dB |
| NLI | Optimal launch power | Digital back-propagation | 1–4 dB |
| SRS tilt | Power pre-emphasis | ASE idler channels | Tilt control |
| Shot | Higher optical power | Balanced detection | 3–6 dB |
| Thermal | Low-noise TIA | Optical pre-amplifier | 5–10 dB |
5. Interactive Calculators
Four calculators on one consistent model: a multi-span OSNR budget, a modulation-format reach check, the GSNR-versus-launch-power optimum, and a GSNR-limited reach estimate. Simulator 3 is the one to sit with — sweep launch power and watch GSNR climb on ASE, peak, then fall as nonlinearity takes over.
6. Techniques and Solutions
Hybrid EDFA + Raman
Distributed Raman gain inside the transmission fiber (counter-propagating pumps about 100 nm below the signal) cuts the loss the EDFA must restore, lifting effective OSNR by 2–5 dB and approaching the quantum noise limit. The cost is pump management, intensity-noise transfer, and double-Rayleigh scattering.
Low-NF EDFA design
A two-stage architecture (low-NF first stage, power second stage with mid-stage filtering), 980 nm pumping, and high inversion hold NF to 4.0–4.5 dB with 20–25 dB gain and ±0.5 dB flatness — each dB of NF is a dB of OSNR.
Digital back-propagation
Solving the nonlinear Schrödinger equation in reverse via the split-step method recovers 1–3 dB of nonlinear penalty and 15–30% reach on nonlinearity-limited links, but the FFT load (100s of GOPS) and sensitivity to parameter mismatch limit deployment.
Probabilistic constellation shaping
Sending low-amplitude symbols more often than high-amplitude ones shapes the distribution toward Gaussian, buying 0.5–1.5 dB of shaping gain and fine-grained rate adaptation. It is standard in 400G+ coherent systems and transparent to the network.
| FEC type | Net coding gain | Overhead | Application |
|---|---|---|---|
| RS(255,239) | 5.8 dB | 6.7% | Legacy 10G |
| Hard-decision LDPC | 8.5 dB | 20% | 100G coherent |
| Soft-decision LDPC | 10–11 dB | 20–25% | 400G/800G |
| Concatenated | 11–12 dB | 30–35% | Submarine |
| Technique | OSNR gain | Complexity | Maturity |
|---|---|---|---|
| Power optimisation | 1–2 dB | Low | Deployed |
| Large-Aeff fiber | 1.5–2.5 dB | Low | Deployed |
| Raman | 2–4 dB | Medium | Deployed |
| Digital back-propagation | 1–3 dB | Very high | Limited |
| Probabilistic shaping | 0.5–1.5 dB | Medium | Widely deployed |
| Hollow-core fiber | 10+ dB potential | Low (once deployed) | Trials |
7. Design Methodology
Define capacity, distance, and target BER; pick a modulation format for the distance; build the power and OSNR budgets; assess nonlinearity through GSNR; then verify margin. The format-by-distance starting point:
| Distance | Format | Typical OSNR |
|---|---|---|
| < 200 km | 64QAM or higher | 24–30 dB |
| 200–600 km | 16–32QAM | 18–22 dB |
| 600–2000 km | 8–16QAM | 14–18 dB |
| > 2000 km | QPSK | 11–14 dB |
The power budget is PRX = PTX − (αLN) + (GN) − connector − splice − system margin; the OSNR budget is the 58-form above. Then find the launch power that maximises GSNR — too low is ASE-limited, too high is NLI-limited, and the optimum for SMF usually sits at 0 to +3 dBm per channel. For wideband systems, add the SRS tilt and design the pre-emphasis profile so the worst channel still clears its GSNR requirement.
Pitfalls: skip the implementation margin and the link fails as it ages — carry 2–3 dB; quote OSNR while ignoring NLI and the prediction is optimistic — compute GSNR; push launch power for more OSNR past the optimum and nonlinearity wins; treat each band independently in a multiband system and the S-band starves; and never subtract a separate bandwidth term on top of the +58 constant.
Pre-deployment checklist
Power budget: received power meets sensitivity, ≥ 2 dB margin, all connector/splice loss counted. OSNR: end-of-life OSNR meets the format, ≥ 2 dB margin, ASE accumulation summed over N spans. Nonlinearity: launch power optimised per channel or band, GSNR verified, SRS tilt handled, FWM checked where dispersion is low. Dispersion and PMD: accumulated CD within the DSP window, PMD coefficient below 0.1 ps/√km. FEC: overhead adequate for the target post-FEC BER, operating at pre-FEC 10-4 or better. Monitoring: per-channel OSNR, power, and pre-FEC BER with sensible alarm thresholds.
8. Applications and Case Studies
Practical Example — 2000 km S+C+L terrestrial.
Across an ultra-wideband route, SRS drives more than 10 dB of tilt from S-band down to L-band, so uniform launch fails. Pre-emphasis (S-band +5 dBm, C-band +2 dBm, L-band −1 dBm), per-band amplifiers, ISRS-aware per-channel power, ASE idlers to hold the tilt during add/drop, and adaptive modulation (16QAM on S and L, 32QAM on C) delivered S-band OSNR around 15.5 dB, C-band 19.2 dB, and L-band 16.8 dB — about 31.5 Tb/s total with tilt held under 2 dB within each band. The lesson: a wideband system is one coupled optimisation, not three independent bands.
| Symptom | Likely cause | Fix |
|---|---|---|
| High BER on all channels | Low OSNR (ASE) | Check amplifier gains, raise launch power |
| BER rises with power | Nonlinear penalty | Back off to the optimum (about +1 to +2 dBm) |
| Edge channels poor | Gain tilt or filter narrowing | Adjust tilt, check WSS shapes |
| Gradual OSNR drift | Amplifier aging | Compare to baseline, replace pumps |
| S-band failing (wideband) | Excessive SRS depletion | Raise S-band launch, tune pre-emphasis |
| Intermittent errors | PMD or polarization | Check DGD over time, inspect stressed fiber |
| Application | Distance | Format | Required OSNR |
|---|---|---|---|
| Submarine | 5000–10000 km | QPSK | 11–13 dB |
| Ultra-long-haul | 2000–5000 km | QPSK/8QAM | 13–16 dB |
| Long-haul | 600–2000 km | 16QAM | 17–19 dB |
| Regional | 200–600 km | 16–32QAM | 18–22 dB |
| Metro core | 80–200 km | 32–64QAM | 21–25 dB |
| DCI | 10–120 km | 64–256QAM | 24–32 dB |
| Technology | Band | Typical NF | Best use |
|---|---|---|---|
| EDFA | C+L (1530–1625 nm) | 4–6 dB | Standard C/L-band |
| TDFA | S (1460–1530 nm) | 5–7 dB | S-band |
| Distributed Raman | All bands | ~3 dB (near quantum) | Reach extension |
| SOA | O/C/L | 6–9 dB | Compact, integrated |
Main Points
References
- ITU-T, Optical monitoring for dense wavelength division multiplexing systems (G.697), ITU-T Study Group 15.
- P. Poggiolini et al., The GN-Model of Fiber Non-Linear Propagation and its Applications, Journal of Lightwave Technology.
- ITU-T, Forward error correction for high bit-rate DWDM submarine systems (G.975.1), ITU-T Study Group 15.
Sanjay Yadav, "Optical Network Communications: An Engineer's Perspective" — Bridge the Gap Between Theory and Practice in Optical Networking.
Developed by MapYourTech Team
For educational purposes in Optical Networking Communications Technologies
Note: This guide is based on industry standards, best practices, and real-world implementation experiences. Specific implementations may vary based on equipment vendors, network topology, and regulatory requirements. Always consult with qualified network engineers and follow vendor documentation for actual deployments.
Feedback Welcome: If you have any suggestions, corrections, or improvements to propose, please feel free to write to us at [email protected]
Related Articles on MapYourTech