

Generic selectors
Exact matches only
Search in title
Search in content
Post Type Selectors
Articles
lp_course
lp_lesson
Back
HomeAutomationOptical Amplifier Noise Figure
Optical Amplifier Noise Figure

Optical Amplifier Noise Figure

Last Updated: April 2, 2026
34 min read
81
Optical Amplifier Noise Figure: Definitions, Calculations, and Design Impact
Deep Dive — Optical Amplifiers

Optical Amplifier Noise Figure

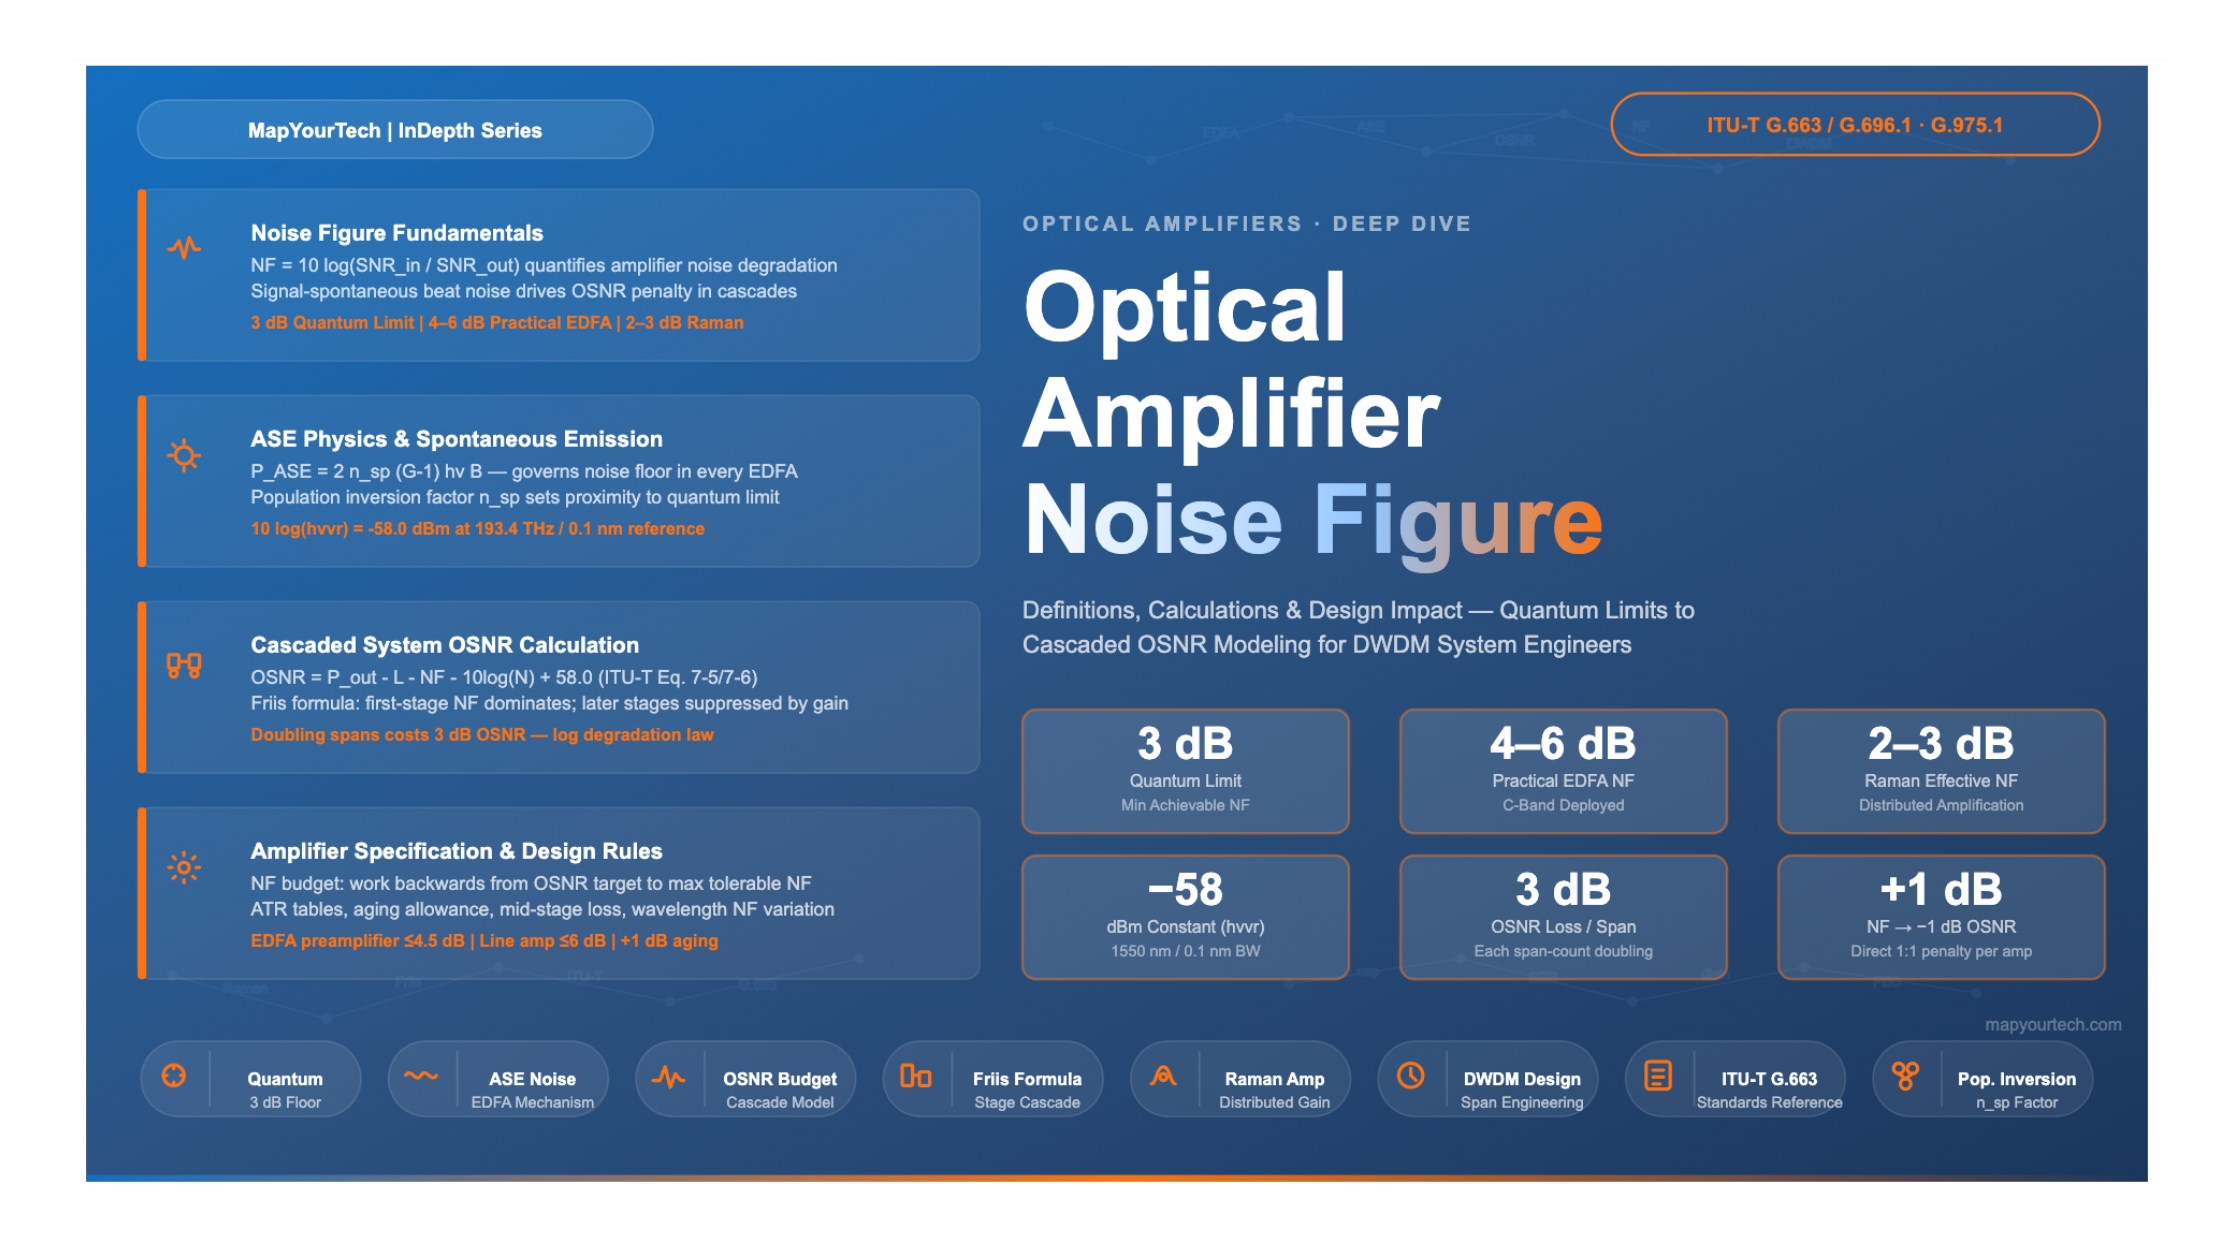
Definitions, Calculations, and Design Impact — A comprehensive reference for optical network engineers covering NF fundamentals, the quantum limit, ASE physics, cascaded system OSNR modeling, and practical amplifier specification.

3 dB Quantum Limit — Minimum Achievable NF
4–6 dB Typical EDFA NF in Deployed Systems
~2–3 dB Effective NF of Distributed Raman
−58 dBm 10 log(hννr) at 193.4 THz, 0.1 nm
Section 1

Introduction

Every optical amplifier, regardless of its type or operating regime, adds noise to the signals it amplifies. This noise degrades the optical signal-to-noise ratio (OSNR) — the primary figure of merit for optical transmission quality — and sets a fundamental limit on how far a signal can travel and how many amplifier stages a system can cascade before the bit error rate (BER) becomes unacceptable.

Noise figure (NF) is the parameter that quantifies this degradation. Expressed in decibels, it measures how much worse the signal-to-noise ratio becomes as the signal passes through the amplifier. An amplifier with a lower noise figure introduces less noise, preserving more of the signal quality. A higher noise figure accelerates OSNR degradation, shortening reach, reducing capacity, or forcing the system engineer to use stronger forward error correction (FEC) with its associated overhead penalties.

Understanding noise figure — what it is, what sets its physical limits, how it interacts with gain and span loss, and how it accumulates across cascaded amplifier chains — is one of the most essential competencies in optical network design. Whether specifying amplifiers for a greenfield long-haul DWDM deployment, troubleshooting margin issues in an existing metro link, or evaluating hybrid EDFA-Raman architectures for submarine cables, the engineer who understands NF can make informed, defensible design decisions.

This article provides a rigorous yet accessible treatment of optical amplifier noise figure. It begins with the physical origins of amplifier noise, derives the key formulas, explains the quantum limit, and then works through cascaded system OSNR calculations following the equations documented in ITU-T technical references. It closes with practical guidance on how to specify amplifiers and where noise figure fits into an end-to-end system margin budget.

Section 2

Physical Origins of Amplifier Noise

2.1 Amplified Spontaneous Emission in EDFAs

The dominant noise mechanism in Erbium-Doped Fiber Amplifiers (EDFAs) is Amplified Spontaneous Emission (ASE). To understand why ASE is unavoidable, consider what happens inside the erbium-doped fiber when it is pumped.

A high-power pump laser at either 980 nm or 1480 nm excites erbium ions from their ground state into a higher energy level. As these excited ions decay back toward the ground state, most do so via stimulated emission — releasing photons that are phase-coherent copies of the incoming signal photons, producing gain. However, a fraction of excited ions decay spontaneously, emitting photons at random phases and into random spatial modes. These spontaneously emitted photons are then themselves amplified by the surrounding excited-state erbium population as they propagate along the fiber. The result is a broadband optical noise floor that co-propagates with the signal and cannot be removed by optical filtering alone, since it occupies the same wavelength band as the signal.

The ASE noise power PASE generated by the amplifier can be expressed as:

ASE Noise Power
P_ASE = 2 × n_sp × (G - 1) × hν × B
nsp — spontaneous emission factor (population inversion factor); equals 1 for a fully inverted amplifier
G — amplifier power gain (linear)
— photon energy (Planck's constant × optical frequency), approximately 1.28 × 10⁻¹⁹ J at 1550 nm
B — optical bandwidth over which ASE is integrated (Hz)

The factor of 2 accounts for ASE in both polarization modes. The term (G − 1) rather than G reflects that an ideal zero-noise amplifier of gain G has no ASE at all; the minimum ASE arises from the quantum nature of light itself and cannot be suppressed below this floor.

2.2 Noise in Raman Amplifiers

Raman amplifiers have a different noise mechanism. Signal amplification occurs through stimulated Raman scattering (SRS) — the transfer of energy from a high-power pump (typically 1450–1500 nm) to a lower-frequency signal via the vibrational modes (phonons) of the silica fiber lattice. The principal noise process is spontaneous Raman scattering, which occurs even in the absence of an input signal and generates photons at the signal wavelength with random phases.

Because Raman amplification is distributed — it happens continuously throughout the transmission fiber rather than at a discrete lumped point — the signal is amplified as it attenuates, keeping its optical power relatively constant along the span. This is the key reason that Raman amplifiers can achieve significantly lower effective noise figures than EDFAs: the signal never falls to a very low level before being amplified, so the signal-to-noise ratio at any point along the fiber is much better than in a system where the signal travels the full span at its attenuated level before hitting a lumped EDFA.

Raman amplifiers typically achieve effective noise figures of 2–3 dB, and in certain distributed configurations the effective noise figure measured at the input of the span can appear negative on the decibel scale — meaning the Raman gain has more than compensated for the span loss, leaving the SNR better than it was at the fiber input.

2.3 Noise in Semiconductor Optical Amplifiers

Semiconductor optical amplifiers (SOAs) use carrier population inversion in a semiconductor gain medium. They are more compact and electrically pumped, but they typically carry higher noise figures — in the range of 5–10 dB — due to the inherent noisiness of the semiconductor gain process and incomplete population inversion at practical operating points. SOAs also suffer from pattern-dependent gain saturation, limiting their use to applications such as metro colorless add/drop and optical switching rather than multi-span line amplification.

Section 3

Noise Figure: Definition and the Quantum Limit

3.1 Formal Definition

In the microwave and RF world, noise figure is defined as the ratio of the signal-to-noise ratio at the amplifier input to the signal-to-noise ratio at the output, expressed in decibels:

Noise Figure — General Definition
NF = 10 × log10( SNR_in / SNR_out )   [dB]

Equivalently, in terms of linear noise figure F:
F = SNR_in / SNR_out   [linear, dimensionless]
A noiseless amplifier adds no noise, so SNRout = SNRin, giving NF = 0 dB (F = 1). Any practical amplifier degrades the SNR, so NF > 0 dB (F > 1).

For optical amplifiers, the relevant SNR is defined in terms of signal and ASE noise power measured in a defined reference bandwidth — typically 0.1 nm (approximately 12.5 GHz at 1550 nm). This is the same bandwidth reference used in OSNR measurements, making the formulas directly compatible.

3.2 Noise Figure for EDFAs — The Population Inversion Formula

For an EDFA operating in the high-gain regime (G >> 1), the noise figure simplifies to a clean relationship with the spontaneous emission factor nsp:

EDFA Noise Figure (High-Gain Approximation)
F ≈ 2 × n_sp   [linear]

NF ≈ 10 × log10(2 × n_sp)   [dB]
nsp — spontaneous emission factor = N2 / (N2 − N1), where N2 is the excited-state erbium population and N1 is the ground-state population.
When the amplifier is fully inverted (N1 = 0, nsp = 1): NF = 10 log10(2) = 3.01 dB — the quantum limit.
In practice, incomplete inversion increases nsp above 1, raising NF above the quantum floor.

3.3 The 3 dB Quantum Limit

The 3 dB quantum limit is a fundamental boundary set by quantum mechanics. Even a perfect EDFA with complete population inversion (all erbium ions in the excited state, nsp = 1) must generate at least one spontaneous photon per gain mode per unit bandwidth to satisfy the Heisenberg uncertainty principle. This floor produces exactly 3 dB of noise figure degradation — the amplifier cannot help but add some noise because the very act of amplifying with gain G requires (G − 1) spontaneous emission events alongside the G stimulated ones.

Why 3 dB and Not Less
Premium Article — Free 20% Preview

Read the Full Analysis with Premium

The remaining 80% of this article — the design numbers, trade-offs and field guidance — is part of MapYourTech Premium, along with the full premium library, courses and professional tools.


Instant access · Cancel anytime · 48-hour trial available
Sanjay Yadav

Optical Communications & Network Automation Expert | Author of 3 Books for Optical Engineers | Founder, MapYourTech

Optical networking engineer with nearly two decades of experience across DWDM, OTN, coherent optics, submarine systems, and cloud infrastructure. Founder of MapYourTech.

Follow on LinkedIn

You May Also Like

52 min read 12 0 Like The Submarine Cable Stack: Open Cables, GSNR, SDM and Power Skip to main content...
  • Free
  • July 10, 2026
32 min read 10 0 Like Coherent DSP Architecture: From ADC Samples to Client Bits MAPYOURTECH | COHERENT OPTICS DEEP...
  • Free
  • July 10, 2026
42 min read 14 0 Like Building an Optical NOC Dashboard with OpenConfig Telemetry Skip to main content MapYourTech |...
  • Free
  • July 10, 2026

Course Title

Course description and key highlights

Course Content

Course Details
