Animated CTA Banner
MapYourTech
MapYourTech has always been about YOUR tech journey, YOUR questions, YOUR thoughts, and most importantly, YOUR growth. It’s a space where we "Map YOUR Tech" experiences and empower YOUR ambitions.
To further enhance YOUR experience, we are working on delivering a professional, fully customized platform tailored to YOUR needs and expectations.
Thank you for the love and support over the years. It has always motivated us to write more, share practical industry insights, and bring content that empowers and inspires YOU to excel in YOUR career.
We truly believe in our tagline:
“Share, explore, and inspire with the tech inside YOU!”
Let us know what YOU would like to see next! Share YOUR thoughts and help us deliver content that matters most to YOU.
Share YOUR Feedback
Tag

Signal transmission

Browsing

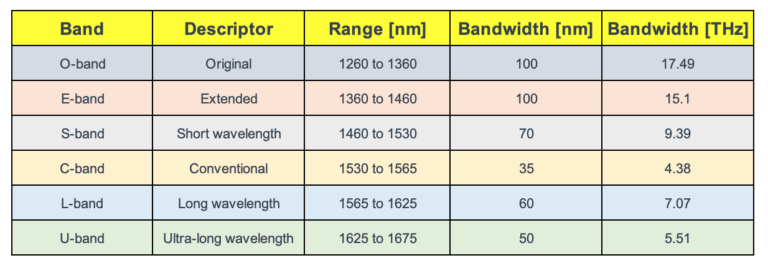
When we talk about the internet and data, what often comes to mind are the speeds and how quickly we can download or upload content. But behind the scenes, it’s a game of efficiently packing data signals onto light waves traveling through optical fibers.If you’re an aspiring telecommunications professional or a student diving into the world of fiber optics, understanding the allocation of spectral bands is crucial. It’s like knowing the different climates in a world map of data transmission. Let’s explore the significance of these bands as defined by ITU-T recommendations and what they mean for fiber systems.

#opticalband

The Role of Spectral Bands in Single-Mode Fiber Systems

Original O-Band (1260 – 1360 nm): The journey of fiber optics began with the O-band, chosen for ITU T G.652 fibers due to its favorable dispersion characteristics and alignment with the cut-off wavelength of the cable. This band laid the groundwork for optical transmission without the need for amplifiers, making it a cornerstone in the early days of passive optical networks.

Extended E-Band (1360 – 1460 nm): With advancements, the E-band emerged to accommodate the wavelength drift of uncooled lasers. This extended range allowed for greater flexibility in transmissions, akin to broadening the canvas on which network artists could paint their data streams.

Short Wavelength S-Band (1460 – 1530 nm): The S-band, filling the gap between the E and C bands, has historically been underused for data transmission. However, it plays a crucial role in supporting the network infrastructure by housing pump lasers and supervisory channels, making it the unsung hero of the optical spectrum.

Conventional C-Band (1530 – 1565 nm): The beloved C-band owes its popularity to the era of erbium-doped fiber amplifiers (EDFAs), which provided the necessary gain for dense wavelength division multiplexing (DWDM) systems. It’s the bread and butter of the industry, enabling vast data capacity and robust long-haul transmissions.

Long Wavelength L-Band (1565 – 1625 nm): As we seek to expand our data highways, the L-band has become increasingly important. With fiber performance improving over a range of temperatures, this band offers a wider wavelength range for signal transmission, potentially doubling the capacity when combined with the C-band.

Ultra-Long Wavelength U-Band (1625 – 1675 nm): The U-band is designated mainly for maintenance purposes and is not currently intended for transmitting traffic-bearing signals. This band ensures the network’s longevity and integrity, providing a dedicated spectrum for testing and monitoring without disturbing active data channels.

Historical Context and Technological Progress

It’s fascinating to explore why we have bands at all. The ITU G-series documents paint a rich history of fiber deployment, tracing the evolution from the first multimode fibers to the sophisticated single-mode fibers we use today.

In the late 1970s, multimode fibers were limited by both high attenuation at the 850 nm wavelength and modal dispersion. A leap to 1300 nm in the early 1980s marked a significant drop in attenuation and the advent of single-mode fibers. By the late 1980s, single-mode fibers were achieving commercial transmission rates of up to 1.7 Gb/s, a stark contrast to the multimode fibers of the past.

The designation of bands was a natural progression as single-mode fibers were designed with specific cutoff wavelengths to avoid modal dispersion and to capitalize on the low attenuation properties of the fiber.

The Future Beckons

With the ITU T G.65x series recommendations setting the stage, we anticipate future applications utilizing the full spectrum from 1260 nm to 1625 nm. This evolution, coupled with the development of new amplification technologies like thulium-doped amplifiers or Raman amplification, suggests that the S-band could soon be as important as the C and L bands.

Imagine a future where the combination of S+C+L bands could triple the capacity of our fiber infrastructure. This isn’t just a dream; it’s a realistic projection of where the industry is headed.

Conclusion

The spectral bands in fiber optics are not just arbitrary divisions; they’re the result of decades of research, development, and innovation. As we look to the horizon, the possibilities are as wide as the spectrum itself, promising to keep pace with our ever-growing data needs.

Reference

https://www.itu.int/rec/T-REC-G/e

Power Change during add/remove of channels on filters

The power change can be quantified as the ratio between the number of channels at the reference point after the channels are added or dropped and the number of channels at that reference point previously. We can consider composite power here and each channel at same optical power in dBm.

So whenever we add or delete number of channels from a MUX/DEMUX/FILTER/WSS following equations define the new changed power.

For the case when channels are added (as illustrated on the right side of Figure 1 ):

where:

A   is the number of added channels

U   is the number of undisturbed channels

For the case when channels are dropped (as illustrated on the left side of Figure 1):


where:

D   is the number of dropped channels

U   is the number of undisturbed channels


 Figure 1

For example:

–           adding 7 channels with one channel undisturbed gives a power change of +9 dB;

–           dropping 7 channels with one channel undisturbed gives a power change of –9 dB;

–           adding 31 channels with one channel undisturbed gives a power change of +15 dB;

–           dropping 31 channels with one channel undisturbed gives a power change of –15 dB;

refer ITU-T G.680 for further study.