Animated CTA Banner
MapYourTech
MapYourTech has always been about YOUR tech journey, YOUR questions, YOUR thoughts, and most importantly, YOUR growth. It’s a space where we "Map YOUR Tech" experiences and empower YOUR ambitions.
To further enhance YOUR experience, we are working on delivering a professional, fully customized platform tailored to YOUR needs and expectations.
Thank you for the love and support over the years. It has always motivated us to write more, share practical industry insights, and bring content that empowers and inspires YOU to excel in YOUR career.
We truly believe in our tagline:
“Share, explore, and inspire with the tech inside YOU!”
Let us know what YOU would like to see next! Share YOUR thoughts and help us deliver content that matters most to YOU.
Share YOUR Feedback
Tag

Optical receivers

Browsing

Signal integrity is the cornerstone of effective fiber optic communication. In this sphere, two metrics stand paramount: Bit Error Ratio (BER) and Q factor. These indicators help engineers assess the performance of optical networks and ensure the fidelity of data transmission. But what do these terms mean, and how are they calculated?

What is BER?

BER represents the fraction of bits that have errors relative to the total number of bits sent in a transmission. It’s a direct indicator of the health of a communication link. The lower the BER, the more accurate and reliable the system.

ITU-T Standards Define BER Objectives

The ITU-T has set forth recommendations such as G.691, G.692, and G.959.1, which outline design objectives for optical systems, aiming for a BER no worse than 10−12 at the end of a system’s life. This is a rigorous standard that guarantees high reliability, crucial for SDH and OTN applications.

Measuring BER

Measuring BER, especially as low as 10−12, can be daunting due to the sheer volume of bits required to be tested. For instance, to confirm with 95% confidence that a system meets a BER of 10−12, one would need to test 3×1012 bits without encountering an error — a process that could take a prohibitively long time at lower transmission rates.

The Q Factor

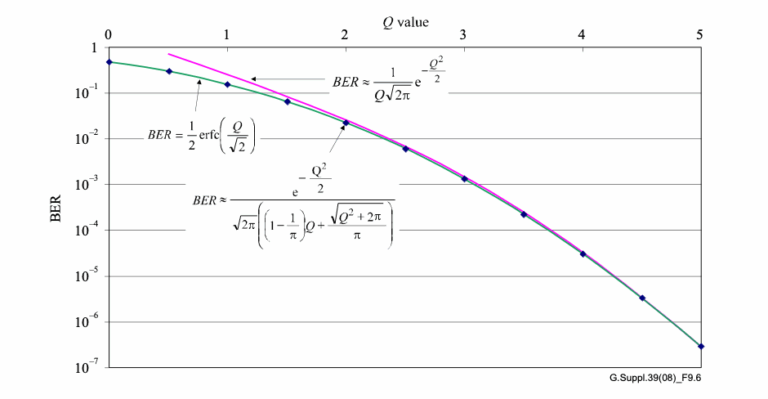
The Q factor measures the signal-to-noise ratio at the decision point in a receiver’s circuitry. A higher Q factor translates to better signal quality. For a BER of 10−12, a Q factor of approximately 7.03 is needed. The relationship between Q factor and BER, when the threshold is optimally set, is given by the following equations:

The general formula relating Q to BER is:

bertoq

A common approximation for high Q values is:

ber_t_q_2

For a more accurate calculation across the entire range of Q, the formula is:

ber_t_q_3

Practical Example: Calculating BER from Q Factor

Let’s consider a practical example. If a system’s Q factor is measured at 7, what would be the approximate BER?

Using the approximation formula, we plug in the Q factor:

This would give us an approximate BER that’s indicative of a highly reliable system. For exact calculations, one would integrate the Gaussian error function as described in the more detailed equations.

Graphical Representation

ber_t_q_4

The graph typically illustrates these relationships, providing a visual representation of how the BER changes as the Q factor increases. This allows engineers to quickly assess the signal quality without long, drawn-out error measurements.

Concluding Thoughts

Understanding and applying BER and Q factor calculations is crucial for designing and maintaining robust optical communication systems. These concepts are not just academic; they directly impact the efficiency and reliability of the networks that underpin our modern digital world.

References

https://www.itu.int/rec/T-REC-G/e

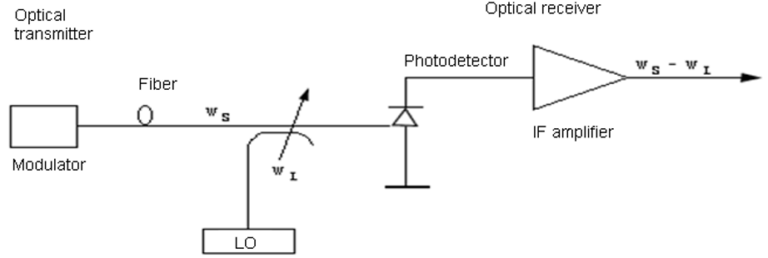
As we know that either homodyne or heterodyne detection can be used to convert the received optical signal into an electrical form. In the case of homodyne detection, the optical signal is demodulated directly to the baseband. Although simple in concept, homodyne detection is difficult to implement in practice, as it requires a local oscillator whose frequency matches the carrier frequency exactly and whose  phase is locked to the incoming signal. Such a demodulation scheme is called synchronous and is essential for homodyne detection. Although optical phase-locked loops have been developed for this purpose, their use is complicated in practice.

Heterodyne detection simplifies the receiver design, as neither optical phase locking nor frequency matching of the local oscillator is required. However, the electrical signal  oscillates rapidly at microwave frequencies and must be demodulated from the IF bandto the baseband using techniques similar to those developed for microwave communication systems. Demodulation can be carried out either synchronously or asynchronously. Asynchronous demodulation is also called incoherent in the radio communication literature. In the optical communication literature, the term coherent detection is used in a wider sense.

A lightwave system is called coherent as long as it uses a local oscillator irrespective of the demodulation technique used to convert the IF signal to baseband frequencies.

*In case of homodyne coherent-detection technique, the local-oscillator frequency is selected to coincide with the signal-carrier frequency.

*In case of heterodyne detection the local-oscillator frequency  is chosen to differ from the signal-carrier frequency.